Where Are Markets Today?
European and U.S. equity markets are trading slightly higher to start the new trading week, indicating a potential attempt at bouncing back as the global markets ended another week of trading with losses. Futures on the Dow Jones Industrial Average are trading higher by around 153 points, or 0.3 percent. Futures on the S&P 500 and Nasdaq-100 are trading higher by around 0.3 percent. European index futures are also trading slightly higher, suggesting that markets across Europe and the U.S. are attempting to recover as the S&P 500 posted its third consecutive losing week, closing last week 1.6 percent lower. The Dow Jones Industrial Average and Nasdaq Composite fell 2 percent and 1.3 percent, respectively. Markets are trading cautiously higher as investors reassess the market impact of geopolitical events surrounding the ongoing war between Iran and the U.S., as well as considering whether the recent decline in the markets was overextended relative to the economic fundamentals.
One of the major factors affecting the current futures positioning is the ongoing volatility in the global energy markets. The price of Brent crude has been trading at around $105 per barrel, while the price of West Texas Intermediate crude has been trading at around $100 per barrel. The prices of oil increased last week as there was severe disruption to the shipping of crude through the Strait of Hormuz, which is considered to be one of the most important shipping routes for global energy supplies. The United States has confirmed that there were military strikes on Iranian military targets located on the island of Kharg. Although the energy infrastructure was not directly affected, there was a warning that such infrastructure might be targeted if the shipping routes are not opened up. This has resulted in the prices of oil rising significantly, affecting the global markets and resulting in the decline of the global equity markets last week. Despite the ongoing geopolitical tensions, there has been an improvement in the market sentiment as there are indications that the United States might be planning to form an alliance of countries to provide escort ships through the Strait of Hormuz. This might help to alleviate the current tensions as there will be no risk of supply disruptions to the global markets. This has helped to stabilize the market at the beginning of the current week. There are also indications that the ongoing geopolitical tensions are not affecting the global markets as much as they should as corporate earnings are expected to remain robust. Forecasts for earnings per share growth for 2026 and 2027 are considered to be very optimistic, and this has helped to keep the S&P 500 at around 5 percent below its all-time high, indicating that the global economic growth is considered to be intact.
Looking ahead, investors are positioning for key events that are expected to shape the direction of the markets over the coming days. The Federal Reserve will hold its second monetary policy meeting of the year, and although no change to interest rates is expected, markets will be keenly watching statements regarding inflation and economic growth. Additionally, the technology sector will be closely monitored as a major artificial intelligence conference gets underway, with investors keen to gauge the future demand for semiconductors and AI infrastructure spending. In combination with oil markets and geopolitical events, these factors will shape whether the recent advance in European and US futures extends into a sustained recovery or merely serves as a temporary blip within a wider phase of market volatility.
Major Index Performance as of Monday, 16 Mar 2026
- Nasdaq Composite: Trading at around 16,100 as technology and artificial intelligence stocks continue to face downward pressure.
- S&P 500: Trading at around 5,160 as investors weigh economic indicators, interest rate assumptions, and geopolitical events.
- Russell 2000: Trading at around 2,070 as markets weigh the strength of the domestic economy.
- Dow Jones Industrial Average: Trading at around 38,900 as defensive sectors and industrial companies provide support to the index.
The Magnificent Seven and the S&P 500
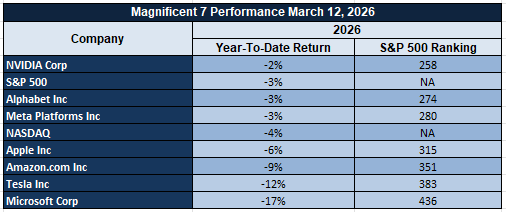
The Magnificent Seven, consisting of Apple, Microsoft, Nvidia, Amazon, Meta Platforms, Alphabet, and Tesla, are the dominant contributors to the S&P 500 and Nasdaq Composite Index. However, these stocks are currently under pressure as they had a huge runup due to the strength of artificial intelligence and digital infrastructure. The current market environment is such that investors are reassessing these stocks to determine the sustainability of the exceptional earnings growth potential embedded within these names. As interest rates remain relatively high, companies with significant future earnings potential tend to be more sensitive to valuation. Consequently, portfolio rebalancing and profit-taking within these technology giants has put downward pressure on these major indexes.
Drivers Behind the Market Move – Monday, March 16, 2026
As the markets open today in the United States and Europe, investors are dealing with an intricate combination of geopolitical risks, energy market volatility, and economic indicators that are expected to influence monetary policy. The developments surrounding the Strait of Hormuz, the White House announcements regarding military operations and shipping security, and the release of early-cycle manufacturing surveys are all impacting market sentiment today. The combination of these factors will continue to influence the way markets are positioned today as they attempt to recover from last week’s losses.
- Middle East Conflict and Oil Supply Risks
The ongoing geopolitical risks emanating from the Middle East continue to be at the forefront of market risks today. Over the weekend, the President of the United States announced that the U.S. had conducted strikes on Iranian military targets located on Kharg Island. The U.S. also announced that additional action will be taken to address the ongoing risks to shipping routes through the Strait of Hormuz. The administration also appealed to other major economies such as China, France, Japan, and the United Kingdom to assist in securing the shipping routes through the Strait of Hormuz. The ongoing risks emanating from the Middle East are impacting the stability of the global oil supply, considering that the Strait of Hormuz supplies a significant amount of global oil demand. The ongoing risks emanating from the Middle East have also seen the price of crude oil move significantly higher, with Brent crude trading at over $100 per barrel. The rise of crude prices has seen inflation risks rise, impacting sectors such as transportation and manufacturing.
2. Shipping Security and Energy Market Stabilization Initiatives
In addition to these military initiatives, policy initiatives that have been put in place for the stabilization of global shipping routes have also had an effect on investor sentiment. The government has announced that it is considering the option of escorting oil tankers through the Strait of Hormuz, and it is currently working with a number of other countries to ensure the security of maritime shipping routes. It has been reported that a coalition of countries is planning to begin coordinated naval patrols in an attempt to keep shipping routes open. This has helped to stabilize investor sentiment, as it is seen as an attempt to bring some much-needed stability to global shipping routes. However, it has also been announced that the conflict might end within weeks, which might have a positive effect on the price of oil in the near future.
3. Economic Data and Growth Outlook
Investors are also watching economic indicators that will come in to gauge the health of the overall economy. Today’s Empire State Manufacturing Index is one of the first economic indicators of the month that measures manufacturing activity. It is also an important indicator of the momentum in the manufacturing sector. A strong number will indicate that manufacturing activity remains strong despite the geopolitical tensions and higher borrowing costs. This will likely have a positive effect on sectors that benefit from economic growth. A weaker-than-expected number will indicate that manufacturing activity may be slowing down. This will likely have a negative effect on sectors that benefit from economic growth. It may also indicate that monetary policy may become more accommodative in the future. Manufacturing indicators often provide a preview of what to expect in the overall economy. Therefore, the release of this economic indicator is leading to a wait-and-see attitude among investors.
In summary, it can be said that the current global market is being influenced by the combination of geopolitical issues affecting energy supply routes, the actions of governments to secure shipping and energy market stability, and the release of data that will have an impact on monetary policy. In this regard, it can be seen that the equity futures in both the US and Europe are sensitive to news headlines, which is an indication of the current market environment.
Digesting Economic Data
The TRUMP Tweets and Their Implications
Recent comments emanating from the White House over the period from March 13th to March 15th, 2026, have had a profound effect upon global market sentiment, especially in the energy, shipping, and geopolitical risk space. In essence, the President of the United States announced that the Administration was in the process of examining the Jones Act shipping regulations and was also willing to look at other regulations in the face of the growing crisis in the Strait of Hormuz, which is arguably one of the most important oil shipping lanes in the world. At the same time, the Administration also announced that the United States was willing to escort oil tankers through the Strait of Hormuz in order to ensure the stability of the global oil supply chain. For markets, the comments have had an immediate effect upon geopolitical risk levels, especially in the oil markets.
The geopolitical tensions escalated even further as it was confirmed that the United States had targeted military installations on Iran’s Kharg Island and that more action was possible if shipping routes continue to be threatened. The President also warned that the United States was capable of attacking Iranian oil infrastructure as well if maritime security continues to worsen. These events are significant to financial markets as the Island of Kharg is considered to be one of the most significant Iranian oil export locations. The threat of infrastructure attacks here will cause global oil supplies to tighten very quickly. The President also declined to discuss ceasefire negotiations but encouraged other major economies of the world, including China, France, Japan, and the United Kingdom, to become involved in securing the Strait. This was seen as a signal that the current conflict might be escalating into a broader multinational security operation.
Along with these geopolitical events, there were also other economic announcements that the administration had put into place to strengthen economic infrastructure. The White House announced new executive orders that will be aimed at addressing issues of fraudulent “Made in America” products, improving Federal Trade Commission capabilities to address these issues, and requiring federal agencies to review product labels to ensure accurate information on product origins. Other orders included housing affordability and construction, including removing obstacles to homebuilding, increasing the pace of permits being granted to states and cities, and increasing mortgage credit availability. These economic policies are aimed at stimulating investment within the United States, lowering housing costs, and increasing manufacturing competitiveness. From the perspective of the markets, these policies are aimed at increasing supply chains and economic production capabilities within the United States while maintaining economic stability within the country as geopolitical tensions rise globally.
In spite of this rise in military activities, the White House also announced that the ongoing war with Iran could come to an end in a matter of weeks. This implies that the prices of oil may fall when stability returns to the region. It was announced that the administration is working to ensure that there is enough supply while at the same time working in conjunction with other countries to ensure that the shipping lanes remain open. At the same time, the President announced that the administration had been able to secure trillions of dollars in new investments while at the same time reaffirming their dedication to national security, trade protection for domestic industries, and accountability in government spending. For the financial markets, the activities of the White House have created a complex environment where international security, stability in the oil market, and economic policy have become inextricably intertwined.
Consumer Inflationary Outlooks Increase as Energy Price Concerns Escalate
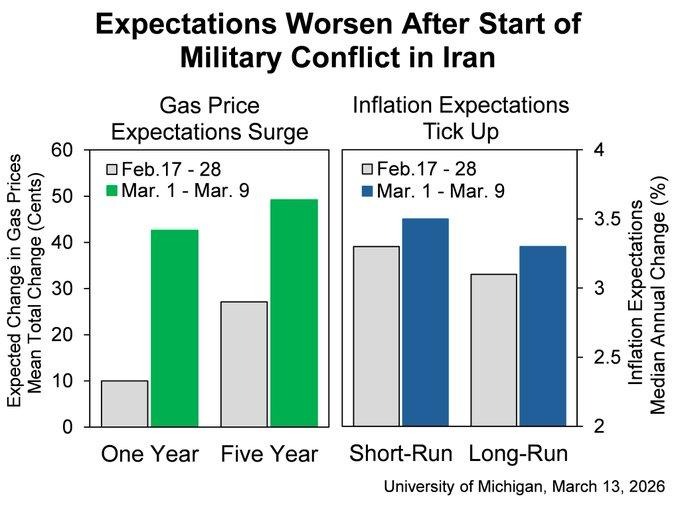
The recent consumer sentiment report reveals an observable increase in the short-term inflation outlook as consumers react to the uncertainty in the global energy market. The survey reveals that consumers now expect gasoline prices to increase substantially in the next year, thus increasing their expectations for inflation in the short term. This change in the inflation outlook is a result of consumers becoming increasingly sensitive to changes in energy prices due to the recent disruptions in the oil transportation routes and the uncertainty of the supply of energy in the major global energy routes. As consumers expect higher fuel prices, they also expect prices to rise in the transportation, food, and household sectors, thus affecting their spending patterns in the economy.
Despite the increase in the short-term inflation outlook, the long-term outlook remains fairly stable, indicating that consumers expect inflation to moderate once the supply disruptions are stabilized. However, the continuous rise in energy prices may pose a challenge to the monetary policy as central banks remain keen on monitoring inflationary expectations when making decisions on interest rates. As consumers and businesses continue to expect price increases, interest rates may remain high for a longer period to ensure that inflation does not become a persistent force in the economy. This development has major implications for sectors that are highly dependent on favorable financing conditions, while businesses that are directly associated with energy production and supply stability may have improved earnings visibility during a period of rising energy prices.
In light of these trends, we believe that Chevron Corporation (CVX) is potentially undervalued in the current market. As one of the world’s largest integrated energy producers with substantial upstream oil production, the company is poised to benefit from the continued strength of crude prices due to geopolitical supply disruptions. The company’s diversified business segments in exploration, production, refining, and distribution enable it to capitalize on the entire energy value chain as global supply tightens. Analysts are advised to track oil transportation volumes through strategic shipping lanes, refinery operating rates, and inventory levels in global crude markets to assess whether the current pressures in the energy sector are sustained for a prolonged period to facilitate a continued earnings growth trend for large energy producers.
Job Openings Increase to 6.946 Million, Indicating Strong Labor Demand
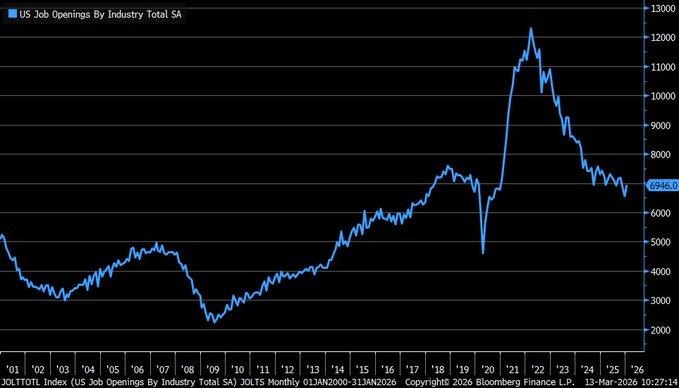
According to the latest Job Openings and Labor Turnover Survey, total job openings increased to 6.946 million in January 2026, beating market forecasts of 6.75 million and higher than the previous month’s revised figure of 6.55 million. The figures indicate that despite the cooling trend in various sectors of the economy, labor demand continues to remain strong. Looking at the historical trends of seasonally adjusted job openings since 2001, it can be seen that labor demand increased significantly after the global recovery phase, peaking at a figure above 11 million in 2022 but has since stabilized around the 7 million mark. This is an indication that the labor market is moving from an overheated state to a more balanced state but still remains strong in terms of labor demand.
A more detailed analysis of the labor market data shows that job hiring and voluntary job leaving are still quite low compared to the high levels observed during the initial recovery period. The steady level of job openings but slower pace of hiring suggests that companies continue to look for workers but are doing so with caution regarding adding more workers to their payroll. Companies seem to be prioritizing flexibility in their operations while also paying attention to overall economic trends such as wage pressures, borrowing costs, and productivity gains. When job openings are high but hiring slows down, companies tend to prioritize investments in productivity-enhancing technology over significant workforce expansion, which can help redefine corporate capital expenditure priorities.
Under these circumstances, our view is that Microsoft Corporation (MSFT) is currently undervalued in relation to its structural growth trajectory. As a key player in the enterprise software, cloud infrastructure, and artificial intelligence productivity solutions markets, Microsoft directly benefits from corporate efforts to optimize business efficiency and automate business processes in a labor market environment that is stable but cautious. Companies operating in a labor market environment where labor demand is steady but hiring is slow tend to prioritize investments in cloud infrastructure, digital collaboration tools, and automation solutions that enhance business productivity without incurring significant workforce expenses. Analysts are advised to pay close attention to enterprise cloud infrastructure spending trends, corporate technology spending cycles, and productivity software adoption to assess whether the current labor market conditions continue to fuel demand for digital workplace solutions.
GDP Growth Rate Slows to 0.7% with Government Spending Contraction
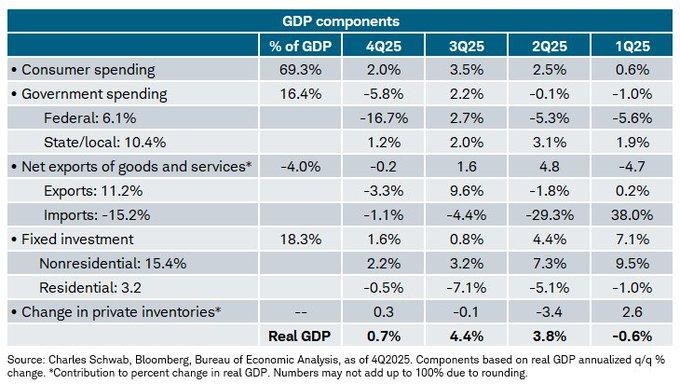
The recent economic data indicates that the real GDP growth rate for the fourth quarter of 2025 has been revised considerably lower to 0.7% annualized from the previous estimate of 1.4%. The revision is attributed to the lower economic momentum, especially with the contraction in fiscal spending that occurred during the quarter. Government spending registered a contraction of -5.8%, led by the -18.7% contraction in federal spending. This was one of the factors that contributed most to the slowdown in economic growth during the quarter. Net exports also contributed a slight -0.2% to the GDP, with trade offering little support to economic growth during the quarter. The data suggests that fiscal consolidation and lower external demand were factors that contributed to the slowdown in economic momentum in the approach to 2026.
Despite the slowdown in government spending and trade sector contributions, the private sector demand remained relatively stable. Consumer spending grew by 2.5%, which is a clear indication of the resilience of consumer spending despite the tightening of borrowing conditions. Fixed investment also made a positive contribution of 1.6%, which is a clear indication that businesses are still investing in equipment, infrastructure, and productivity-enhancing activities. When consumer spending and business investments continue to grow while the government spending slows down, the economy becomes increasingly reliant on the private sector. This situation can create a scenario where companies that are connected to consumer spending and technology productivity improvements continue to record stable revenue growth despite the slower GDP growth.
Based on the above scenario, we believe that Apple Inc. (AAPL) is undervalued compared to its long-term growth potential. As a global leader in consumer technology hardware, digital ecosystems, and subscription-based services, the company continues to be closely connected to household spending patterns that continue to record resilience despite the slower headline economic growth. The diversified revenue base of Apple Inc. in devices, digital services, and software platforms continues to provide stability to earnings during a period when the overall economic momentum slows down. Analysts should focus on consumer spending trends, global device upgrade cycles, and service revenue growth to determine whether the stable household spending continues to support technology sector earnings despite the slower overall GDP growth.
Capital Goods Shipments Deteriorate 0.1% as Softening Business Investment Becomes a Reality
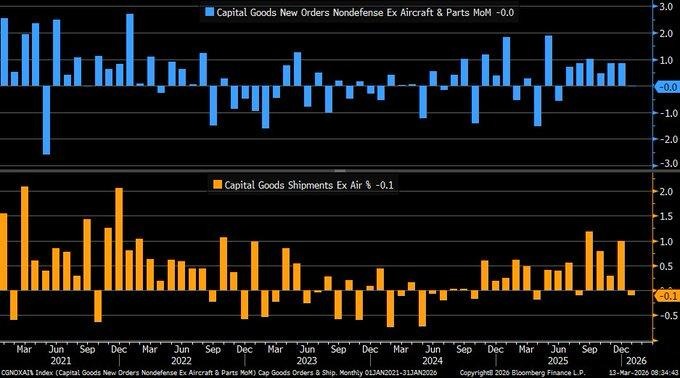
Recent economic indicators reveal that core capital goods shipments fell -0.1% in January 2026, which is well below economists’ forecasts of a +0.4% rise and reverses the +1.0% increase in December. Core capital goods shipments are a proxy for non-defense capital goods shipments excluding aircraft and are widely regarded as one of the most influential leading indicators of business investment. As core capital goods shipments are a proxy for the shipment of machinery, equipment, and technology used by businesses to increase productive capacity, even small declines in this series can be an early indicator of business spending trends.
The information also indicates that new orders for core capital goods were effectively flat during the same period, which further supports the idea that firms are taking a more cautious approach to investment. When both shipments and orders are down at the same time, it is often a sign that firms are waiting before making additional equipment purchases until financial conditions improve or visibility into demand improves. In the past, such periods of paused business investment have historically occurred when interest rates are high and firm executives are more inclined to hold onto cash rather than make significant investments in expansion projects. While such periods can sometimes precede economic slowdowns, they have historically led to policy changes intended to stabilize investment conditions rather than indicating an imminent economic slowdown.
In this context, we believe that Caterpillar Inc. (CAT) is currently undervalued compared to its long-term demand scenario. As one of the world’s leading producers of construction equipment, industrial machinery, and infrastructure development systems, Caterpillar is directly affected by global capital spending cycles. Periods of temporarily paused business investment have historically created valuation opportunities for industrial equipment suppliers before infrastructure spending and capital expenditures recover. The firm’s extensive global distribution network and broad exposure to the construction, mining, and energy infrastructure markets make it well-positioned to capitalize on investment activity once it stabilizes. Analysts should pay close attention to capital expenditure plans of large industrial firms, infrastructure spending commitments, and financial conditions for corporate borrowers to assess whether the current pause in equipment shipments represents a temporary lull before the next investment cycle.
Personal Income Increases by 0.4%, Consumer Spending Remains Resilient
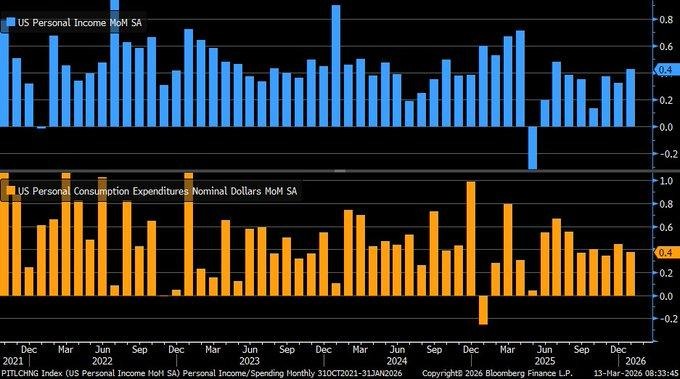
In the latest data on personal income, income for households has grown by 0.4% in January 2026, slightly lower than the market consensus but still improving from 0.3% in December 2025. This is a moderate increase in wages and salaries, as well as government transfer payments. Personal income is a significant indicator as it measures the income available for consumption by the public. Though this increase is slightly lower than market consensus, the improvement from the prior month suggests that overall conditions in this space are still favorable. However, inflation based on personal consumption expenditures is still high at 3.1%, indicating elevated conditions.
Consumer spending, which accounts for the bulk of overall economic activity, registered an increase of 0.4%. This was above the forecasted 0.3%. Moreover, it was in line with the previous month’s levels. This shows that households are able to maintain their consumption levels even in a scenario where borrowing costs are high. This is a significant indicator because it shows that households are still in a condition to spend and support overall economic activity even in a scenario where interest rates are high. These data are also significant indicators of overall economic growth because consumption patterns directly feed into overall GDP growth calculations.
Given this scenario, it is clear that Walmart Inc. (WMT) is undervalued compared to its peer group in the overall consumer sector. This is because it is one of the largest retail operators in the market and has significant operations in essential goods, groceries, and household items, which are consumed by households even in a scenario where living costs are high. This is because households look to spend and maintain their consumption levels even in a scenario where living costs are high. It is imperative that analysts look at real disposable income growth, overall consumer spending patterns in retail stores, and inflation rates in essential goods retail stores to get a better idea of whether household consumption patterns are holding up and providing support to retail stores in the overall consumer sector.
PCE Inflation Eases to 2.8% as Core Prices Remain at 3.1%
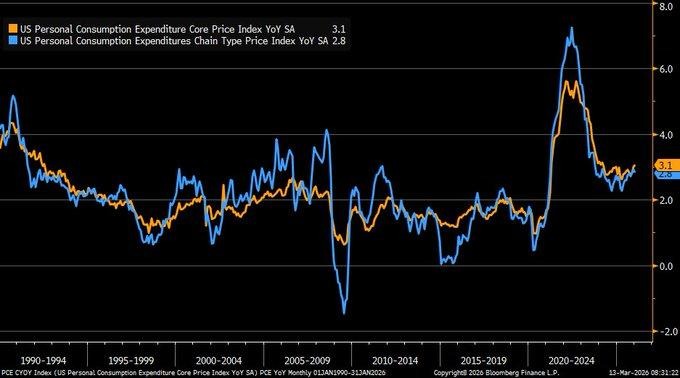
The recent Personal Consumption Expenditures inflation data indicates that headline inflation rose by 2.8% from last year, which is slightly lower than the expected 2.9% market consensus. Core PCE inflation, which is a more accurate measure of inflation as it does not include food and energy prices, remained at 3.1% as expected. This indicator is closely tracked as it provides insight into the prices of goods and services in the overall economy. The recent economic data indicates that inflationary pressures are gradually easing compared to the rapid price growth observed in the early years of the decade. The historical perspective of PCE inflation, as evident in the recent economic data, indicates that inflation rose to nearly 7% in 2022 before steadily declining to the current level over the past few years, indicating the success achieved in easing inflationary pressures in consumer markets.
However, the fact that core inflation remains above the long-term 2% target for an extended period of time suggests that price pressures have not yet fully normalized. Core services, housing-related prices, and some consumer prices remain in a slower phase of progress towards lower inflation. At the same time, weaker economic indicators such as decelerating job growth and decelerating GDP growth suggest that economic momentum is slowing. When inflation gradually decreases while economic growth slows, monetary policymakers face a challenging balancing act between preserving price stability and fostering economic growth. This is why financial markets remain highly attuned to inflation trends, as a sustained period of disinflation can set the stage for future changes to borrowing costs if economic growth continues to slow.
Under these circumstances, we believe that Alphabet Inc. (GOOGL) is currently undervalued in relation to its fundamental structural growth drivers. As a world leader in digital advertising solutions, cloud infrastructure solutions, and artificial intelligence solutions, Alphabet Inc. enjoys stable corporate marketing budgets and rising enterprise demand for cloud-based solutions. As inflation moderates and financing conditions stabilize, enterprises typically boost spending on digital transformation, data infrastructure, and artificial intelligence solutions to enhance efficiency and drive revenue growth. Analysts should pay close attention to growth in enterprise cloud expenditures, digital advertising demand trends, and corporate technology spending cycles to see if moderating inflation conditions set the stage for a new wave of capital allocation growth in the technology sector.
CEO Outlook Signals Capex Expansion While Hiring Remains Cautious
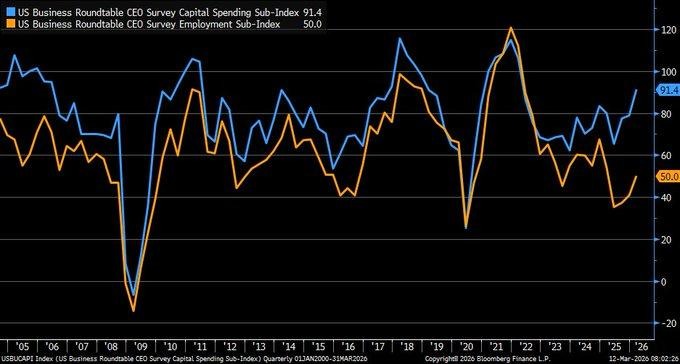
A divergence between corporate capital spending and hiring plans has emerged according to the latest Business Roundtable CEO Economic Outlook Survey for the first quarter of 2026. The capital spending sub-index surged by 12 points to 91, while the employment sub-index gained 9 points to a neutral 50, as half of the surveyed CEOs signaled an increase in hiring while the other half signaled a decrease. The capital spending sub-index indicates a high level of optimism among large corporate leaders, as about 52% of the surveyed CEOs signaled an increase in capital spending, indicating a high level of optimism about long-term investment projects. The increase in the capital spending sub-index indicates an expansionary outlook for the business sector, as companies remain optimistic about growth prospects while remaining cautious about hiring.
The survey data has also highlighted the changes in the strategies adopted by businesses in response to the economic and geopolitical situations. For instance, businesses have been operating in a complex environment characterized by changes in trade policies, supply chain dynamics, and geopolitical tensions in global markets. As a result, businesses have been focusing more on investing in capital assets in infrastructure, automation, and technology to improve productivity, and thus, the need to invest in the workforce has not been a priority. According to the survey data, businesses have been focusing more on investing in capital assets, and this can be seen in the historical data, which indicates that since the economic recovery in 2020, the capital expenditures of businesses have been increasing at a faster rate compared to the employment rates. As a result, businesses have been focusing more on investing in capital assets to improve efficiency and thus enhance competitiveness in the global market.
With the current economic and geopolitical situations, we believe that Rockwell Automation Inc. (ROK) is undervalued compared to the structural changes in the global market, characterized by the adoption of technology to improve productivity in industries. As a leading provider of industrial automation software, smart manufacturing, and digital production management, the company is likely to benefit from the increased capital expenditures in infrastructure and technology to improve efficiency in industries. For instance, businesses that have been focusing on increasing production capacity while maintaining low labor costs have been adopting automation and intelligent manufacturing technology. As a result, analysts should focus on the capital expenditures of businesses and the adoption rates of automation technology in industries to determine whether the current capital spending momentum is likely to result in increased demand for industrial technology providers.
Retail Sales Growth Remains at 6.2% Indicating Strong Consumer Spending
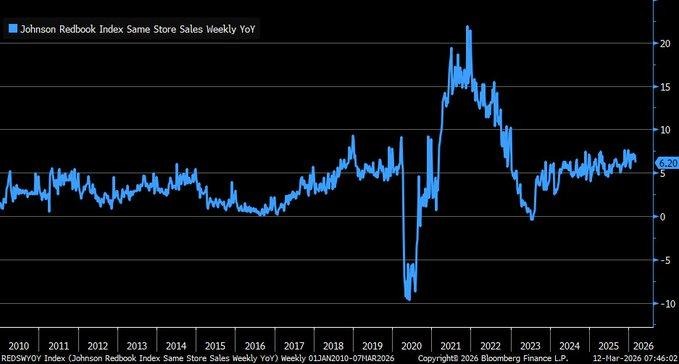
According to the latest weekly retail sales data, the Johnson Redbook Index recorded same-store sales growth of +6.2% year-over-year as of the week ending March 7, 2026. Although this is a slight deceleration from the previous week’s +7.0% growth, it is still well above the average of 3-4% over the long term. The Johnson Redbook Index is a measure of retail sales that tracks the performance of about 9,000 stores across 30 large retail chains. It has been used as a leading indicator of consumer spending patterns since 1980. The fact that it is released on a weekly basis means that it often provides the first indication of consumer spending patterns before the official retail sales figures are released each month. The latest figure indicates that consumer spending is stronger than expected despite the tougher borrowing terms and higher living costs.
Taking a more long-term perspective on the data from 2010 through 2026, it becomes clear that retail activity tends to fluctuate in line with economic cycles. During times of economic growth, it is common to see same-store sales growth accelerate as consumers become more confident in their discretionary spending and continue to drive demand for goods and services. The current reading above 6% suggests that consumers continue to drive economic growth even as other data points have suggested that growth may be slowing. For instance, retail sales in January 2026 reflected relatively flat spending levels, but weekly data such as the Redbook Index continue to suggest that consumer spending is holding up well. Consumer spending is an essential driver of economic growth, as it represents the largest part of economic activity and has a direct impact on corporate revenue growth in the retail and consumer sectors.
Under these circumstances, it appears that Costco Wholesale Corporation (COST) is currently undervalued in relation to the current trends of consumer spending. As a large-scale membership-based retailer with substantial exposure to the sale of household goods, groceries, and other essential consumer products, Costco stands to benefit from continued consumer spending levels during times of economic uncertainty. The company’s business model of bulk purchasing, pricing competitiveness, and loyal membership base puts it in a prime position to capitalize on sustained consumer demand for value-driven purchasing options. Analysts should pay close attention to weekly retail sales trends, membership growth rates, and consumer spending trends in essential goods categories to determine whether strong retail demand continues to support earnings growth for large-scale retailers.
Housing Starts Up 2.6%, Permits Down 5.4%
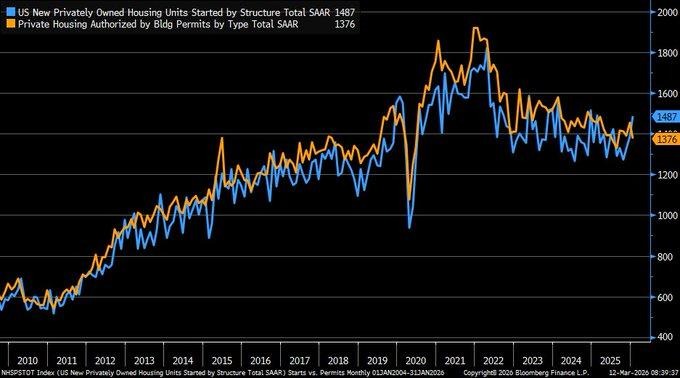
Recent data on the housing market has shown a significant split between residential construction and permits. Housing starts have risen by 2.6 percent in January 2026, with a seasonally adjusted annual rate of 1,487,000 units. This is a strong indicator that construction is still ongoing on projects that were in progress even before borrowing costs started to climb. However, building permits have fallen by 5.4 percent during this period, resulting in 1,376,000 units. This is a continuation of a declining trend that has been ongoing for nearly two years. Building permits are generally issued six to nine months prior to housing starts. This could be a warning that residential construction could slow down in the coming months as fewer permits are issued for construction to begin.
The disparity in the number of starts and permits also points to the extent to which the housing market is adjusting to the higher and sustained mortgage rates above 6.5%. It can also have a negative effect on potential homebuyers, leading to fewer housing construction projects. Although the ongoing housing construction projects have been supported by approved housing projects initiated in prior periods, the decline in permits also points to a weakening trend in the housing market. In all such situations, research studies based on the housing cycles have shown that a decline in building permits often signals a period when housing construction contributes less to economic growth. Therefore, analysts should also consider the permit trends while assessing the contribution of the housing market to the overall economic growth.
Considering the above market conditions, D.R. Horton Inc. (DHI) appears to be an underpriced company in comparison to the ongoing housing market environment. DHI is one of the leading homebuilding companies that have a strong geographical footprint across the country. It offers a wide range of housing products that can benefit from the ongoing demand in regions where housing shortages have been pronounced. Large homebuilding companies like DHI have a competitive edge over their counterparts in situations where other homebuilders have reduced their new housing projects. Therefore, analysts should also consider the ongoing trends in mortgage rates and future permit approvals to assess the housing market environment.
Investor Sentiment Turns Bearish as Bull-Bear Spread Declines to -14.5%
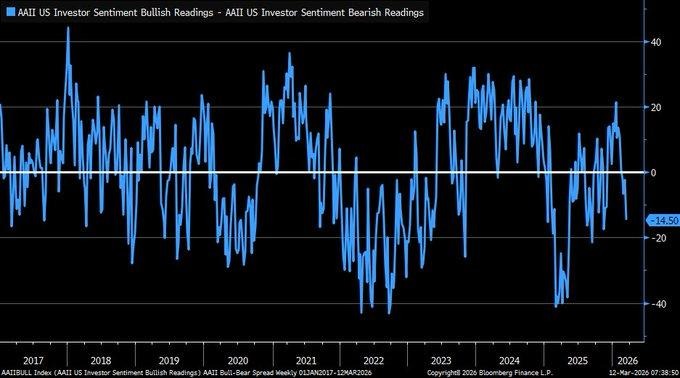
The latest results of the weekly investor sentiment survey show that market sentiment turned sour in the week ending March 12, 2026, as the bull-bear spread declined to -14.5%. This week’s results show a significant drop in market sentiment from the prior week’s results, when the bull-bear spread was at -2.5%. In the latest survey, bearish sentiment was seen to have risen significantly to 46% following a 1.5% decline in the S&P 500. The bull-bear spread refers to the difference between the number of investors who expect the market to rise and the number of investors who expect the market to fall.
Although this recent increase in bearish sentiment is significant, we note that this level is still above historically extreme capitulation readings. In prior market cycles, sentiment readings near -30% have often occurred in tandem with periods of extreme bearishness in which investors expect additional declines in the market. Historical analysis of the sentiment index since 2017 reveals that periods in which sentiment readings have experienced significant declines have preceded equity market rallies 70% of the time. This is due in part to the fact that sentiment readings often move to extremes near market turns. In periods in which investors are overly cautious or fearful, this can often create conditions in which even modest improvements in economic data or corporate profit growth can stimulate renewed buying interest.
We therefore believe that NVIDIA Corporation (NVDA) is undervalued in relation to its long-term structural growth prospects. NVIDIA is a leading developer and marketer of high-performance computing processors for artificial intelligence systems, data centers, and high-performance computing applications. NVIDIA is a leader in one of the fastest-growing segments in the technology space. Periods in which overall market sentiment is negative often create periods in which high growth technology companies experience valuation compression even in periods in which demand fundamentals for their products continue to grow strongly. Analysts should monitor overall investor sentiment trends and corporate spending on artificial intelligence infrastructure in order to gauge overall market confidence.
Upcoming Economic Events
Empire State Manufacturing Index In Focus As Markets Watch Factory Activity
As markets continue to navigate through mixed economic signals, focus now turns to the upcoming release of the Empire State Manufacturing Index. This economic indicator measures the level of manufacturing activity in the New York region and is the first monthly look at industrial activity in the United States. As it relates to new orders, shipments, employment, and business conditions in factories, investors are keenly focused on this economic indicator in order to assess whether the pace of manufacturing activity is picking up or slowing down. In a world where several economic indicators have pointed to a slowdown in economic activity, the Empire State Manufacturing Index will be the first indication of whether the manufacturing sector is slowing down or holding steady.
Empire State Manufacturing Index
- If the actual figure exceeds the forecast, it would indicate that manufacturing activity is growing at a faster pace than anticipated. This is generally a positive indicator, as stronger manufacturing activity is often associated with improving demand conditions, higher production volumes, and increased business optimism. Such an outcome could help industrial and manufacturing-linked stocks advance as investors take heart from the fact that the overall economy is still doing well. However, it could also have an impact on monetary policy expectations, as a strong economy could lead to delays in interest rate cuts. In this case, bond yields could rise, while industrial equipment manufacturers, logistics firms, and raw material suppliers could benefit from renewed optimism about industrial growth.
- If the actual figure falls short of the forecast, it would indicate that manufacturing activity is slowing down due to the impact of rising borrowing costs and global trade tensions on business investment decisions. In this case, investors could turn cautious in equity markets, especially in industrial and cyclical stocks that are heavily dependent on manufacturing growth. In this scenario, defensive stocks could attract investor attention, while expectations of interest rate cuts by central banks could rise as a means to boost economic growth. Analysts would need to focus on the sub-components of the data release, such as new orders, shipments, and employment levels, to assess whether the slowdown is a one-off event or a trend of slowing demand for manufacturing activity in the economy.
Stock Market Performance
Indexes Recover From August Lows While Breadth Remains Uneven
Overall, the equity markets have staged a considerable recovery since the August 4, 2025 lows, but at the same time, the overall market data for the major stock market indexes continues to highlight uneven breadth within the market. While the overall stock market recovery has been considerable, the overall drawdowns for the individual stocks that make up the major market indexes have been notably higher, reflecting that the overall market recovery has been skewed towards a smaller number of the larger stocks. As a commentary team at Zaye Capital Markets, our analysis of the overall stock market data continues to highlight that, overall, investors should remain cautious due to the fact that overall market breadth has not yet begun to participate in the overall stock market rally.
As a result, our analysis of the overall stock market data can be represented in the following manner, focusing exclusively on the data that has been reported to us:
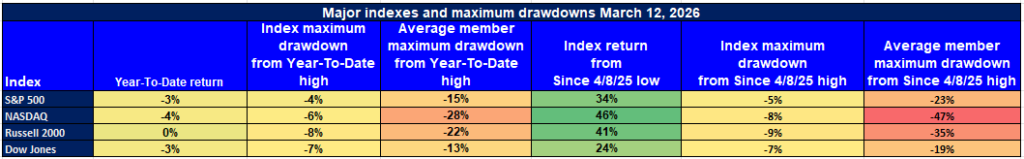
S&P 500: Moderate Recovery With Controlled Drawdowns
YTD: -3% | +34% since Aug 4 low | -4% from YTD high | Avg. member: -15%
The overall stock market data for the S&P 500 has seen a moderate year-to-date loss of 3%, reflecting the overall volatility that has been seen in the stock market during the early part of the year. While the overall stock market has staged a considerable recovery of 34% since the August 4, 2025 lows, the fact that the overall drawdown for the individual stocks that make up the overall S&P 500 has been notably higher at 15% reflects that the overall stock market rally has been skewed towards a smaller number of the overall stocks that make up the S&P 500.
NASDAQ: Strongest Recovery But Deep Member Volatility
YTD: -4% | +46% since Aug 4 low | -6% from YTD high | Avg. member: -28%
This is also reflected in the NASDAQ, which has shown the best recovery from the lows, gaining 46% from the August lows. However, this still means that the index is down 4% for the year. This also underscores the significant volatility experienced by growth stocks in the first half of the year. The average member gain for this index is 28%, which means that many technology and growth stocks experienced significantly greater declines than this overall index.
Russell 2000: Small Caps Show Stability Yet Weak Breadth
YTD: 0% | +41% since Aug 4 low | -8% from YTD high | Avg. member: -22%
The Russell 2000 small-cap index is still down 0% for the year. This is a reflection of the weak overall growth in this segment. These companies are more sensitive to overall economic conditions. While this index is up 41% from the lows, the 8% decline from the year-to-date highs and 22% decline for the average member show that this segment is still facing significant headwinds.
Dow Jones: Defensive Structure Limits Volatility
YTD: -3% | +24% since Aug 4 low | -7% from YTD high | Avg. member: -13%
This index is down 3% for the year but is up 24% from the lows. This is a reflection of the defensive structure of this index. The fact that this index is down just 7% from the year-to-date highs is also a reflection of this. However, even this index has seen significant declines in many of its members. The average member is down 13%.
At Zaye Capital Markets, we believe that the disparity between the strength of the overall market indices and the underlying stocks represents an important trend. While it is good to see the market recover from the lows, healthy markets need to show strength across a range of industries and company sizes. Until such time as this is seen, it is still important to maintain our focus on companies that have strong balance sheets, good earnings visibility, and solid business fundamentals.
The Strongest Sector In All These Indices
Energy Leads Sector Performance While Defensive Strength Also Stands Out
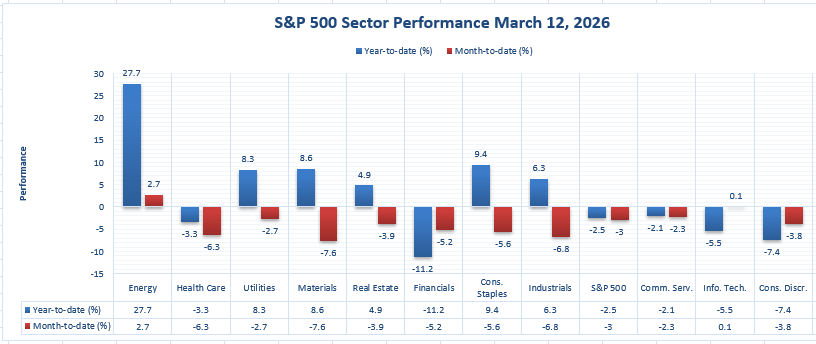
The latest sector performance information available reveals that Energy is the leader in the S&P 500 sector universe, having registered the highest performance on a year-to-date and month-to-date basis. As of 3/12/2026, Energy is the only sector that is up 27.7% year-to-date and 2.7% month-to-date. This is the highest performance in the sector universe, and from our analysis at Zaye Capital Markets, it is clear that this performance is a reflection of investors continuing to rotate into sectors of the market that are most closely linked to commodity strength, supply constraints, and inflation-sensitive earnings. The magnitude of this performance is also worth noting, since no other sector is close to Energy’s performance on a year-to-date basis.
Other sectors that have registered relative strength on a year-to-date basis include Consumer Staples, which is up 9.4%; Materials, which is up 8.6%; Utilities, which is up 8.3%; Industrials, which is up 6.3%; and Real Estate, which is up 4.9%. However, all these sectors registered declines on a month-to-date basis. Consumer Staples is down 5.6%, Materials are down 7.6%, Utilities are down 2.7%, Industrials are down 6.8%, and Real Estate is down 3.9%. This information is significant because it shows that while some sectors have registered strong performance over the period, their performance in the short term is not as strong.
On the weaker side of the chart, Financials has registered the steepest year-to-date loss of -11.2%, followed by Consumer Discretionary with a loss of -7.4%, Information Technology with a loss of -5.5%, Health Care with a loss of -3.3%, and Communication Services with a loss of -2.1%. On a month-to-date basis, Health Care is down -6.3%, Financials are down -5.2%, and Consumer Discretionary are down -3.8%, while Information Technology is the only sector with a positive month-to-date change at 0.1%, although it is down -5.5% on the year. The S&P 500 itself is down -2.5% on the year and -3.0% on the month. The bottom line for us at Zaye Capital Markets is simple: Energy is the clear leader in this chart, both in absolute terms and in consistency, while the rest of the market is clearly still exhibiting much more mixed and tenuous sector-level momentum.
Earnings
Yesterday’s Earnings Recap – March 13, 2026
- VEON Ltd. (VEON) reported strong full-year 2025 performance with total revenue reaching USD 4,399 million, representing a 9.9% year-over-year increase. EBITDA climbed to USD 2,009 million, up 18.8%, producing a margin of 45.7%. Digital revenues expanded sharply to USD 759 million, rising 62.5% year-over-year and representing 17.3% of total revenue, while financial services revenues reached USD 425 million, up 34.3%. The company ended the year with net debt to EBITDA of 1.09x and equity free cash flow after leases and licenses of USD 624 million, supported by a cash position of USD 1,734 million.
- Kyivstar (KYIV), a subsidiary of VEON, delivered particularly strong growth with full-year revenue of USD 1,157 million, up 25.9% year-over-year. Telecom revenue reached USD 1,033 million while digital revenue surged to USD 124 million, representing a 467% increase. EBITDA totaled USD 648 million with a 56.0% margin, and adjusted net profit reached USD 289 million with EPS of USD 1.32. Q4 revenue stood at USD 321 million, up 28.4% year-over-year, with EBITDA of USD 172 million and net profit of USD 90 million.
- RLX Technology Inc. (RLX) reported full-year net revenues of RMB 3,958.9 million (approximately USD 566.1 million), marking a 44.0% year-over-year increase. Q4 revenue reached RMB 1,141.3 million (approximately USD 163.2 million), up 40.3%. Gross margin improved to 31.4% in Q4 from 27% the prior year. International markets represented 76.5% of quarterly revenue, highlighting growing global expansion.
- Buckle Inc. (BKE) reported fiscal year net sales of USD 1.298 billion, up 6.6% year-over-year. Net income reached USD 209.7 million, or USD 4.17 per share basic. In the fourth quarter, sales totaled USD 399.1 million, up 5.3%, while comparable store sales increased 3.9%. Net income reached USD 80.8 million with diluted EPS of USD 1.59. These figures suggest steady consumer demand in specialty retail despite broader economic uncertainties.
Today’s Earnings Preview – March 16, 2026
- Hon Hai Precision Industry: Investors will be keenly interested in production trends, supply chain conditions, and the global demand for electronics. As one of the world’s largest electronics manufacturers, its earnings are a harbinger of consumer electronics shipments, data center hardware sales, and semiconductor supply trends. Market watchers will be keenly interested in revenue growth trends, operating margins, and guidance on manufacturing capacity utilization and technology sector order trends.
- Guotai Junan Securities: The earnings will provide insight into brokerage business, investment banking, and asset management growth in the financial markets. Investors will be interested in trading volumes, capital market participation, underwriting, and margin financing demand as a barometer of overall investor sentiment and financial market liquidity conditions.
- Fubon Financial Holding: The earnings will provide a comprehensive perspective on financial market stability through lending growth, insurance premium income, and investment portfolio performance. Investors will be keenly interested in loan demand trends, net interest margins, and the performance of the wealth management and insurance business to gauge financial services demand trends.
- Dollar Tree: The discount retailer will be an important barometer of consumer spending trends in value-based retail markets. Investors will be interested in same-store sales growth, store traffic, inventory, and pricing trends. Special attention will be paid to operating margins, product mix, and expansion plans as consumers continue to adapt spending habits in response to inflation and economic trends.
At Zaye Capital Markets, we view these earnings reports as key indicators for assessing global supply chain strength, financial market participation, and consumer demand trends as markets progress further into 2026.
Stock Market Overview – Monday, 16 Mar 2026
U.S. stock markets started the week on a subdued note as investors continue to navigate conflicting economic data, high energy costs, and geopolitical tensions. Oil price fluctuations due to tensions in the Middle East continue to keep inflationary pressures in focus. In addition, lower economic data have kept investors guessing about interest rate decisions in the coming months. From our analysis at Zaye Capital Markets, we believe that markets are currently balancing factors such as slower economic growth against expectations of lower interest rates if inflation continues to moderate.
Stock Prices
Economic Indicators and Geopolitical Developments
Today’s market is a balance between lower inflation and slower economic indicators. Though overall inflation is moderating, core inflation is still high, causing interest rate decisions to remain uncertain. In addition, fluctuations in oil prices continue to impact inflation and corporate spending. Manufacturing data and corporate spending on investments indicate that companies are becoming increasingly cautious about spending. However, consumer spending data continues to hold up relatively well. These factors have created a market environment where investors are shifting their focus from one segment to another, focusing on companies with strong earnings visibility and avoiding those with high valuations.
Latest Stock News
- $NVDA – Nvidia continues to lead in artificial intelligence hardware as the company is about to unveil its latest AI infrastructure and hardware at its upcoming developer conference. Management is expected to focus on enhancements to “AI factory” systems for hyperscale computing environments. This is a reflection of the enormous demand for AI infrastructure.
- $TSLA | Tesla is in the news due to Elon Musk’s announcement that Tesla’s large-scale artificial intelligence-based chip manufacturing project, dubbed the “Terafab” initiative, is set to start launching in a matter of days. The move is a clear indication of Tesla’s plans to expand beyond its traditional business of electric cars and play a bigger role in artificial intelligence hardware infrastructure.
- $META | Meta is going through major changes in its structure as it prepares to lay off over 20% of its total workforce. The move is a clear indication of the company’s commitment to keeping costs low while it continues to spend lavishly on artificial intelligence infrastructure and development. At the same time, Meta is strengthening its artificial intelligence ecosystem by integrating new generative artificial intelligence tools with Facebook Marketplace, enabling better listing creation and automated buyer replies. The company is also partnering with some of the biggest media houses in the world to expand real-time news integration with Meta AI and strengthening monetization tools for creators on Facebook to encourage content creation.
- $MSFT | Microsoft is strengthening its artificial intelligence ecosystem by developing validation systems for Nvidia’s upcoming artificial intelligence architecture dubbed Vera Rubin NVL72 in its cloud ecosystem. At the same time, Microsoft Research has come up with a new framework dubbed AgentRx that aims to help identify and diagnose artificial intelligence agent failures, a clear indication of increased demand for artificial intelligence systems by enterprises.
- OpenAI | $GOOGL | $MSFT | OpenAI has extended the capabilities of ChatGPT for enterprises by providing users with a feature to take direct write actions across various productivity ecosystems. This demonstrates the rapid adoption of generative AI in various business environments.
- $AMZN | Amazon is continuing to extend its artificial intelligence infrastructure strategy by forming partnerships with advanced computing companies to offer high-speed AI inference systems in its cloud infrastructure. These systems are aimed at accelerating generative AI for various enterprise users. In another move, Amazon is launching a new premium version of its video streaming service to expand its streaming business.
- $GOOGL | Alphabet is expanding the use of artificial intelligence for geospatial analysis by using Google Earth AI to analyze environmental and public health risk factors. This demonstrates the extent to which various technology companies are incorporating artificial intelligence in various data analysis environments.
- $AAPL | Apple is celebrating its 50th anniversary by hosting global events and product exhibitions to strengthen its brand strength. This is also seen as a milestone in terms of the next phase of innovation for Apple in terms of artificial intelligence integration in various devices.
- $VEON | VEON has reported strong financial results due to rapid growth in digital services and mobile connectivity. The company has also confirmed that it is planning to extend satellite connectivity initiatives by forming partnerships to enhance telecommunications services in emerging markets.
- $ADBE | Adobe has entered into a settlement regarding subscription cancellation and fee issues. This is an important event for the company as the regulatory environment becomes more challenging for the software subscription industry.
- $JD | JD.com has entered into a strategic partnership with an electric car manufacturer to develop fast charging infrastructure networks with retail services such as convenience stores and coffee shops.
The Magnificent Seven and the S&P 500

The Magnificent Seven, consisting of Apple, Microsoft, Nvidia, Amazon, Meta Platforms, Alphabet, and Tesla, are the dominant contributors to the S&P 500 and Nasdaq Composite Index. However, these stocks are currently under pressure as they had a huge runup due to the strength of artificial intelligence and digital infrastructure. The current market environment is such that investors are reassessing these stocks to determine the sustainability of the exceptional earnings growth potential embedded within these names. As interest rates remain relatively high, companies with significant future earnings potential tend to be more sensitive to valuation. Consequently, portfolio rebalancing and profit-taking within these technology giants has put downward pressure on these major indexes.
Major Index Performance as of Monday, 16 Mar 2026
- Nasdaq Composite: Trading at around 16,100 as technology and artificial intelligence stocks continue to face downward pressure.
- S&P 500: Trading at around 5,160 as investors weigh economic indicators, interest rate assumptions, and geopolitical events.
- Russell 2000: Trading at around 2,070 as markets weigh the strength of the domestic economy.
- Dow Jones Industrial Average: Trading at around 38,900 as defensive sectors and industrial companies provide support to the index.
At Zaye Capital Markets, our view is that the markets are transitioning from the AI rally to a broader phase of sector rotation. Until market breadth improves and economic clarity strengthens, we continue to view companies with solid balance sheets, robust cash flow characteristics, and structural growth profiles that can withstand the volatility in the current macro environment.
Gold Price: Why Gold Prices Stay Elevated During War Risk and Interest Rate Uncertainty
The current price of gold, as measured by spot gold, is trading around US $5,007 per ounce. This price has stabilized, remaining slightly below the record highs that were achieved in the market over the past month. This is after it briefly traded above $5,100 per ounce due to the geopolitical tensions that were experienced in the market. However, the current price of gold has been influenced by the complex interplay between geopolitical risk and monetary policy. In the recent past, the White House has made a series of statements that have heightened the risk of geopolitical tensions in the Middle East, especially in the Strait of Hormuz, which is considered to be one of the most important oil shipping routes in the world. In their recent announcements, they have indicated that the US will escort oil tankers in the region, that further strikes against Iranian targets, especially those in Kharg Island, are possible, and that major economies in the world, especially China, France, Japan, and the UK, should send naval support to secure the routes. This is of great importance to the price of gold, especially due to the fact that instability in this route can have negative effects on oil prices, which can in turn affect the level of inflation in different economies in the world. In the face of such uncertainties, gold is considered to be an attractive investment due to the fact that it has the ability to retain value in the face of market volatility.
At the same time, the economic data backdrop is also an important influence for gold. The economic data that was announced yesterday suggests that economic growth is slowing, but it is not slowing at a rate that suggests a significant economic contraction. This suggests that economic growth is slowing, but at the same time, it indicates that inflationary pressures are still present in the economy. This is an uncertain environment for central banks, as it suggests that interest rate policy changes are likely to happen, but it is uncertain just how quickly that might happen. The Empire State Manufacturing Index, which is due out today, is an important economic indicator that investors will be watching closely. If it comes in lower than expected, it suggests that economic growth is slowing, which is generally good for gold because it suggests that interest rates are likely to be cut in the near term, which is good for gold. If it comes in higher than expected, it suggests that economic growth is stronger than expected, which might put a temporary lid on gold as it suggests that interest rate cuts are farther off, which might cause the currency to rise and bond yields to increase. However, the fact that gold is trading at the $5,000 level suggests that the markets are currently pricing in three major themes: ongoing geopolitical tensions related to global energy supply, ongoing inflationary pressures related to high oil prices, and ongoing monetary policy sensitivities related to economic growth. In this environment, gold is continuing to serve as a geopolitical hedge as well as a macroeconomic risk management tool.
Oil Prices: Why Oil Prices Are Rising Again Amid Strait of Hormuz Tensions
The current global oil market is trading at higher prices as geopolitical events continue to influence oil prices. Brent crude is currently trading at $105.03 per barrel, while WTI is trading at $99.64 per barrel, based on the latest market data available as of 16 March 2026. The main reason for the recent price increase is the rising geopolitical tension in the Strait of Hormuz, an important waterway through which approximately one-fifth of the world’s oil is transported every day. Recent statements from the White House have heightened market uncertainty. The administration stated that the United States may escort oil tankers through the Strait of Hormuz, that further military strikes against Iranian targets are likely, and that Iran’s energy infrastructure on Kharg Island may become a target if oil tanker routes continue to be threatened. Such factors have substantially raised the perceived risk of supply in the oil market. When oil market traders perceive that oil shipments are likely to be disrupted—even for a short period of time—futures markets tend to respond rapidly by driving prices higher to account for the anticipated shortage. This is why Brent crude has broken through the $100 barrier while WTI is close to doing the same. Market commentary currently circulating among macro traders and financial market analysts also points out that any disruption to oil tanker routes in the Gulf region would result in an almost immediate tightening of global supply conditions.
However, economic indicators are still affecting demand outlooks and short-term price movements. Yesterday’s macroeconomic data indicated that economic growth is slowing down but still growing, which is a mixed signal for oil demand. Normally, slowing growth would mean lower fuel consumption forecasts, but current geopolitical risks to supply are dominating this sentiment. Today’s Empire State Manufacturing Index will be of great interest to energy market participants, as manufacturing activity is directly linked to industrial fuel consumption. A reading below market expectations could mean that industrial demand for crude oil may slow down, thus halting the current price rally. On the other hand, a strong reading will further support the sentiment that the global industrial sector is still strong and that demand for energy commodities will continue. News from global energy bodies such as OPEC and the International Energy Agency continues to emphasize that demand fundamentals are strong and that spare capacity is still limited. Consequently, oil prices are now being driven by three factors at once: geopolitical risks to supply routes, global economic momentum uncertainty, and market expectations of future production cuts. With Brent above $100 and WTI close behind, the crude market is extremely sensitive to new geopolitical events, shipping security updates, and economic indicators.
Bitcoin Prices: Why Bitcoin Prices React to War Risk, Oil Shocks, and Global Liquidity
The current Bitcoin prices are trading at around $73,679, as per the latest market prices as of 16 March 2026. The prices are rising as the cryptocurrency market tries to recover from the recent decline due to geopolitical issues around the globe. The prices of the cryptocurrency fell to the $68,000 mark as geopolitical tensions escalated in the Middle East region. The White House released official announcements stating that military strikes had been carried out against Iranian targets. The announcements also stated that energy infrastructure on the Kharg Island of Iran might be targeted. The announcements also called for international naval support to ensure the security of the Strait of Hormuz. The rise in oil prices will cause global financial uncertainty. The prices of Bitcoin reacted to these geopolitical issues as the cryptocurrency traded more as a risk asset instead of acting as a safe-haven asset. The rise in oil prices will also cause issues for the cryptocurrency market as the rise will cause mining costs to rise. This will cause miners to sell the cryptocurrency to cover the rising costs. However, despite the rise and fall of the cryptocurrency prices, the market structure will remain bullish due to the rising demand for the cryptocurrency. The prices will remain above the $70,000 mark as the market will continue to accumulate the cryptocurrency.
At the same time, however, macroeconomic indicators are impacting investor behavior in the digital asset market. The macroeconomic data from yesterday indicated that economic growth is slowing but remaining robust, which is creating uncertainty about future monetary policy actions by central banks. This is important for Bitcoin because it impacts demand due to its strong relationship with overall market liquidity conditions. If the economy slows down further, it could lead to future cuts in interest rates, which could increase global liquidity and, in turn, could positively impact Bitcoin prices in the future. Conversely, strong macroeconomic data could delay such actions and maintain high rates, which could negatively impact Bitcoin prices in the future. The Empire State Manufacturing Index data due today is important for Bitcoin traders because it could provide insight about industrial trends and overall macroeconomic conditions. Additionally, macro data suggests that traders are preparing for large price movements in Bitcoin because futures open interest and whale wallet activity have increased in the recent period of volatility in the market. The overall macro environment may be experiencing some challenges in the short term, but from a structural standpoint, Bitcoin fundamentals are strong with high network security levels, positive institutional inflows, and overall agreement that this period of consolidation in the range of $67,000 to $71,000 is a base prior to the next major move in Bitcoin prices.
ETH Prices: How Ethereum Price is Influenced by ETF Flows, Whale Transactions, and Liquidity
Ethereum is currently trading around $2,263 as of 16 March 2026, based on the latest market information, after a volatile period that impacted the overall cryptocurrency market and other risk assets around the world. Throughout the past few market sessions, Ethereum price movements have been driven by the complex interplay between institutional investment flows, macroeconomic factors, and events within the broader crypto market. Market reports from the previous week suggest that cryptocurrency investment funds and ETF-style institutional investment products continue to build exposure to Ethereum, despite the presence of geopolitical risks and rising energy prices that led to overall risk-off sentiment in global markets. Institutional investment flows are significant because they represent long-term strategic capital allocation decisions, as opposed to trading decisions. Institutional investment flows help to absorb supply in the market during periods of stress and also serve to provide structural support to the asset price. At the same time, Ethereum derivatives markets are showing high positioning levels as market participants increase their exposure to futures contracts, which suggests that market participants are positioning themselves for larger price movements driven by macroeconomic factors, central bank policy expectations, and overall liquidity conditions. The ongoing increase in institutional investment flows and the development of Ethereum-based investment products is further solidifying Ethereum’s position as a foundational digital asset within overall investment portfolios, as opposed to a speculative cryptocurrency.
In addition to institutional flows, the role of whales in Ethereum’s price dynamics has recently come to the forefront as a key factor influencing short-term price action, especially in the context of increased market volatility. On-chain analysis insights shared within the past few days indicate a sharp rise in large wallet transactions involving thousands of ETH being transferred between exchanges, wallets, and personal accounts. Such large transactions tend to indicate the intentions of large investors who control large portions of the circulating supply. In the past, when whales transferred Ethereum to exchanges, markets tended to view such transactions as a potential precursor to selling, which in turn led to downward pressure on prices. However, recent on-chain data now indicate that several large investors have instead withdrawn Ethereum from exchanges and transferred them to cold storage or staking contracts, which is a trend that tends to be seen in accumulation phases and long-term investment decisions. Such trends lead to a reduction in the liquid supply of ETH in the market and an increase in the amount of Ethereum locked into the Ethereum staking system. As more Ethereum is staked in the Ethereum network, the circulating supply in the market tends to get reduced, leading to amplified price actions as a result of increased demand.
