Where Are Markets Today?
European and US stock market index futures have risen slightly higher on early trading on Friday, after the global markets witnessed a sharp sell-off in the previous session, due to the war between Russia and Ukraine, which led to an increase in oil prices. US stock market index futures, which track the Dow Jones Industrial Average, have risen 0.2%, while the S&P 500 and NASDAQ 100 index futures have risen 0.1% each. European stock market index futures have also shown an increase, suggesting that the investors are attempting to recover from the losses incurred in the previous session. At Zaye Capital Markets, we have analyzed that the increase in the stock market index futures is due to the natural market behavior, which occurs after the occurrence of a sharp sell-off, where the investors temporarily hold their positions, awaiting fresh triggers such as economic indicators.
The major factor affecting the overall equity sentiment globally remains the deteriorating conflict between Iran, which has added significant levels of uncertainty to the overall markets. The conflict has also added significant levels of volatility to the markets, given the potential threat to the overall energy supplies from the region, especially considering the fact that the Strait of Hormuz is considered one of the most vital energy corridors for the overall crude oil supplies from the region. The overall energy prices increased significantly during the last session, with crude oil futures touching levels above $81 per barrel for West Texas Intermediate crude, while Brent crude also reported significant gains during the day, representing one of the highest weekly gains in energy prices since the start of 2022. The overall energy prices often have a significant influence on the overall production costs for companies and the overall fuel prices for consumers, which could potentially weigh on the overall profitability and consumption levels for companies and individuals, respectively. As a result, many economically sensitive sectors reported significant declines during the last session of the markets in response to the overall conflict between Iran and the potential threat of geopolitical instability in the region. The other major factor that is influencing the overall markets today is the upcoming employment numbers for the month of February, which is considered to be one of the most vital indicators of the overall economic momentum in the country. The overall employment numbers are expected to report a slowdown in the overall employment growth, with only 50,000 jobs added during the month, compared to the overall employment growth of 130,000 jobs added during the month of January, while the unemployment rate is also expected to remain stable at levels around 4.3%.
In spite of all these fluctuations, it is to be seen how changes in the global energy market will affect the economic impact of oil price rises. The United States has now become a net exporter of oil and energy products over the last few years, and it is also seen that the global economy is now significantly less energy-intensive than it was over the last few decades. However, it is to be seen how oil prices above $100 per barrel will impact the global economy, which will finally affect inflation in all sectors. Currently, it is seen that global futures markets seem to be stabilizing, and all market players are closely watching all the latest developments regarding oil prices, geopolitical factors, and upcoming economic data. At Zaye Capital Markets, we strongly feel that all these factors will be major factors affecting investor sentiment in European and US markets.
Major Index Performance as of Friday, 6 Mar 2026
- Nasdaq Composite: Trading at 23,031, reflecting ongoing volatility within large technology companies while semiconductor and artificial intelligence stocks remain closely watched.
- S&P 500: Trading at 6,932, remaining near record levels as investors balance strong corporate earnings against valuation concerns within mega-cap technology stocks.
- Russell 2000: Trading at 2,670, showing stronger participation among smaller companies as investors rotate toward domestically focused businesses.
- Dow Jones Industrial Average: Trading at 50,116, supported by strength in industrial and financial companies as investors shift toward companies with stable earnings and stronger balance sheets.
The Magnificent Seven and the S&P 500
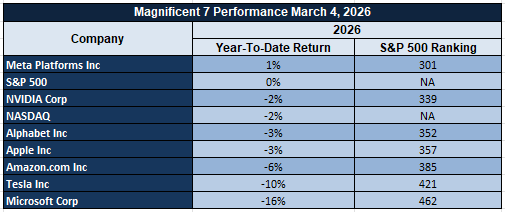
The “Magnificent Seven” — Apple, Microsoft, Nvidia, Amazon, Meta, Alphabet, and Tesla — remain the dominant force within the S&P 500. These companies have driven a large portion of the index’s gains over the past year, but recent trading shows increasing pressure as investors reassess valuations following their significant rally. When these stocks experience declines simultaneously, the broader index often weakens because these companies represent a substantial portion of total market capitalization. This concentration has contributed to periods where the S&P 500 appears stable while many individual stocks experience deeper corrections.
Drivers Behind the Market Move – Friday, March 6, 2026
The US and European markets are currently going through a complex mix of geopolitical tensions, rising energy costs, and the release of vital economic figures. Overall, the markets are attempting to stabilize following a volatile week that witnessed considerable fluctuations in oil costs, the rise in military actions in the Middle East, and the wait for vital figures in the US labor market. All these factors are currently determining the global stock markets today, as the markets are assessing the short-term as well as long-term implications of these factors.
- Escalating Middle East Conflict and Volatility in the Energy Market
The latest geopolitical tensions with Iran have emerged as one of the major factors that are currently determining the market sentiments this week. This is in light of the latest assurances that witnessed the continuation of military operations against Iranian missiles, drones, and naval forces, in addition to the assurance that thousands of strategic targets have already been hit. This has led to considerable volatility in the energy market, considering the fact that the Middle East is a vital region in the transportation of oil to other parts of the world. This led to considerable fluctuations in oil costs earlier in the week, with the price of oil rising to $80 per barrel, the highest in the last few years. This has led to considerable inflation in the economy, which in turn affects the costs of operations for companies, especially in the transportation, manufacturing, and airline industries. This led to a sell-off in the US as well as the European markets this week.
2. Policy Messaging Regarding Energy Markets and Infrastructure
Another factor influencing the markets is the overall policy message related to the cost of energy markets and infrastructure. The recent comments related to the ability of gasoline prices to rise without intervention and the decision not to use the Strategic Petroleum Reserve to stabilize markets may signal that the markets will be left to adjust naturally. However, the discussions related to the potential actions of the energy markets and the possibility of intervention in the oil futures markets by oil industry leaders are important in understanding the overall value of the markets from the perspective of the overall economy. The announcement related to the ability of technology companies to cover the cost of electricity for artificial intelligence data centers, as part of the ratepayer protection agreement, is important in understanding the value of the markets related to infrastructure investments and the ability of the markets to grow related to power demand.
3. Anticipation of Key Economic Data Releases
Another factor at play in the markets is the anticipation of key economic data releases, including labor market and consumer spending data, all of which are set to be released today. The markets are particularly focused on the release of Average Hourly Earnings, Non-Farm Employment Change, Retail Sales, Core Retail Sales, and the Unemployment Rate, which are key gauges of the strength of the overall economy. Stronger than expected employment numbers could reinforce the notion that the overall economy is still performing well, but could also spark concerns about ongoing inflation pressures, particularly when viewed in the context of higher oil prices. Conversely, weaker than expected economic data could suggest that the overall economy is slowing, which could alleviate some concerns about inflation, but spark concerns about future economic growth. The combination of geopolitical tensions and anticipation of key economic data has seen a ‘wait and see’ attitude adopted by investors, resulting in volatile markets in the US and Europe.
In summary, the convergence of geopolitical risks in the Middle East, the increase in price volatility of energy, and the release of key economic indicators have all played their part in the market today. However, investors are balancing the risks while waiting for clearer direction from the economic indicators and the geopolitical events.
Digesting Economic Data
The TRUMP Tweets and Its Implications
The latest series of comments, which were made public on March 5, underscore a strong geopolitical focus, especially with regard to Iran and the Middle East region. The comments that stress how America must be involved in determining the leadership of Iran, combined with those that question the prospects of Ayatollah Khamenei’s son becoming a successor, underscore America’s desire to be actively involved in determining political outcomes. At the same time, encouragement for Iranian Kurdish forces, combined with comments that stress extensive military strikes against Iranian missile, naval, and drone assets, underscore an intensification of strategic pressure. The fact that thousands of targets have been struck, combined with Iranian naval assets suffering major damage, underscores that military operations are active. The impact on financial markets is typically an increase in risk premiums, especially with regard to energy, defense, and safe-haven assets, as investors weigh the probability of prolonged instability.
The energy policy signals that are embedded in the comments also have direct implications for commodity markets. The fact that the increase in gasoline prices is not a primary concern, as well as the fact that the Strategic Petroleum Reserve will not be used, suggests that the administration is willing to let the market dictate fuel costs in the near term. The fact that the administration is assuring the public that the Strait of Hormuz will not be closed is an effort to calm the markets with regard to oil supplies, as this is one of the most important oil routes in the world. The fact that the White House is in contact with leaders in the energy industry with regard to possible policy responses to the crisis, as well as possible actions in the oil futures market, suggests that the administration is aware that the stability of energy prices is an important concern. Overall, this has implications for the investor community in that the combination of geopolitical tensions and the fact that the administration is not taking direct action to stabilize oil markets suggests that the price of oil is volatile and that the Middle East is an important factor in the price of oil.
The fact that the administration is making diplomatic efforts is also an important part of the overall narrative. The fact that the administration is indicating that the Iranians are seeking to negotiate suggests that the administration believes that the Iranians are seeking to negotiate, but the fact that the administration is indicating that this is coming too late suggests that the administration is not optimistic with regard to the prospects for negotiations. The fact that the administration is also indicating that the situation with Cuba is an important concern suggests that the administration is looking beyond the Middle East once the situation is resolved. Overall, this suggests that the administration is aware that the geopolitical situation could have implications for the way in which trade flows, commodity markets, and defense spending are affected.
Similarly, domestic policy messaging was also apparent in the comments, especially in regards to the cost of electricity and the support of large technology companies in the development of power infrastructure for artificial intelligence development. The announcement of the pledge of ratepayer protection by large technology companies, which will ensure that the cost of the demand for the communities for the data centers is covered, is aimed at preventing the cost of power from rising for the communities. This, if successful, could be impactful for the overall cost of investing in artificial intelligence infrastructure and the expansion of the power grid. This, in conjunction with the symbolic remarks for the historical anniversary of the Boston Massacre and the announcement of the upcoming White House ballroom, demonstrates the overall communications strategy that incorporates geopolitics, domestic economic messaging, and symbolism, each of which could have different impacts on investor sentiment.
Rising Unit Labor Costs Signal Margin Pressure as Productivity Slows
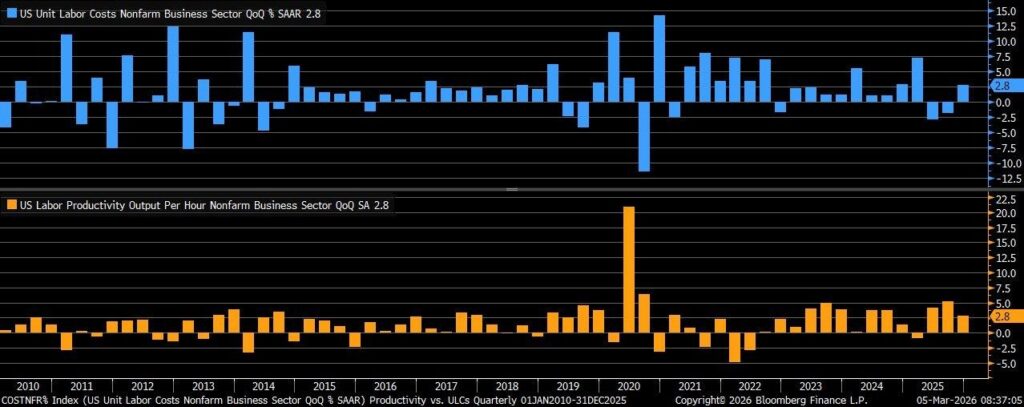
The most recent available preliminary data indicates that unit labor costs increased by 2.8% on a quarterly annualized basis in the fourth quarter of 2025, a reversal of the 1.9% decline in unit labor costs in the prior quarter. The increase in unit labor costs was driven by stronger compensation growth while productivity growth slowed. In other words, companies are paying more for each unit of output produced. We believe that rising unit labor costs are an important macro indicator for us here at Zaye Capital Markets because rising unit labor costs, in the absence of rising productivity, can put pressure on corporate profit margins. Companies can respond to rising unit labor costs in a number of ways, but each option has different implications for inflation and corporate earnings.
Meanwhile, productivity growth in nonfarm businesses has slowed to 2.8%, down from the 4.9% growth recorded in the previous quarter. Although productivity growth is still positive, it has slowed down to indicate that the sharp productivity growth observed during previous economic adjustments has started to normalize. In most cases, when productivity growth slows down while wages rise, companies face a tighter balance between labor costs and productivity growth. This situation may trigger cost-push inflation in which firms increase prices to balance labor costs. Analysts should be keen to watch wage growth indicators, corporate strategies in dealing with labor costs, and inflation rates since all these factors may have significant effects on monetary policy in times when labor costs rise sharply.
Under the above analysis, it seems that Automatic Data Processing Inc. (ADP) has been undervalued considering its long-term prospects in payroll services, workforce management solutions, and business outsourcing. In times when labor costs rise and productivity growth slows down, companies seek better workforce data, payroll solutions, and human capital management solutions to effectively deal with labor costs and improve business productivity. Today, businesses increasingly depend on payroll and workforce analytics solutions to effectively deal with labor costs and improve business productivity. Analysts should be keen to watch corporate strategies in dealing with labor costs and workforce management solutions to determine whether labor costs rise sharply to trigger demand for digital workforce optimization solutions.
Import Prices Fall While Export Growth Slows, Indicating Global Cost Relief
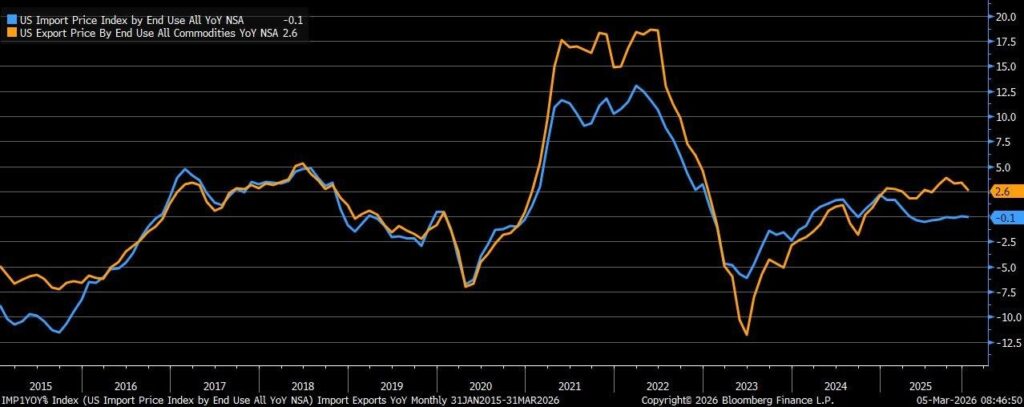
Recent figures on international trade prices indicate a 0.1% drop in import prices on a year-over-year basis in January 2026, indicating a change from the stagnant trend reported in the last few months. This trend could indicate a reduction in inflationary pressure from internationally procured products, especially those relating to raw materials, manufactured materials, and transportation equipment. Based on this, we believe this trend in import price reduction should be seen as a positive indicator of the global supply chain stabilizing and, in turn, normalizing import prices after the fluctuations reported in the early years. A drop in import prices normally has a positive effect on the overall cost of products for companies sourcing their products from international suppliers.
Meanwhile, export prices have risen by 2.6%, which is lower than the previous figure of 3.4%. Although export prices are still increasing, it indicates that the demand for internationally traded commodities and other industrial products may be slowing down. It has been observed in past trends that export prices tend to slow down when commodity demand weakens or when international traders become apprehensive about buying high volumes of industrial products. Based on the above observations, it can be concluded that FedEx Corporation (FDX) appears to be undervalued considering its exposure to international trade activities and global trade flows. As import prices fall and export prices normalize, trade activities may improve due to the increasing volumes of international trade in commodities and other products. The logistics and freight transport industries are generally the first to benefit when trade activities begin to normalize in the international arena.
Based on the above observations regarding changes in import and export prices in the US economy, it can be concluded that FedEx Corporation (FDX) appears to be undervalued considering its exposure to international trade activities and global trade flows. As import prices fall and export prices normalize, trade activities may improve due to the increasing volumes of international trade in commodities and other products. The logistics and freight transport industries are generally the first to benefit when trade activities begin to normalize in the international arena. It would be important to watch global trade volumes and other international trade activities to determine whether export prices are slowing down due to weak commodity demand or other factors.
Jobless Claims Steady as Labor Market Stability Masks Regional Hiring Shifts
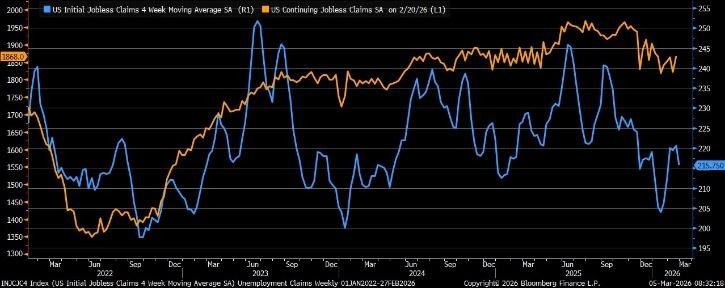
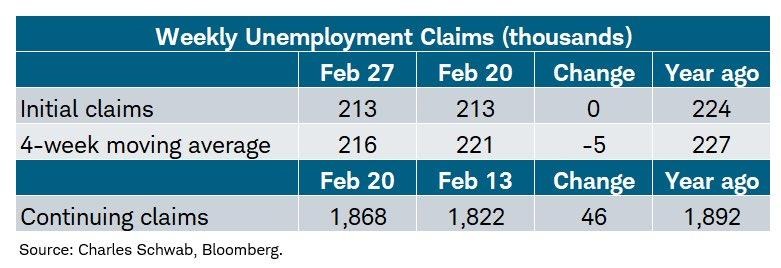
Labor market data indicates that initial claims for unemployment benefits came in steady at 213,000 for the week ending February 27, 2026, a bit below market consensus of 215,000 and unchanged from the prior week. This indicates that layoffs are still contained, and this has strengthened our view that the labor market is still operating at historically tight levels. Based on our perspective at Zaye Capital Markets, a steady claims rate is an indication that businesses are still cautious about reducing their workforces, even though they are concerned about economic conditions. This is a good sign for consumers because a steady claims rate can translate into higher consumer spending.
Looking deeper into the data, there are subtle signs of a potential increase in claims on the horizon. The four-week moving average fell to 216,000 after an increase to 221,000, indicating a steady claims rate. However, continuing claims rose by 46,000 to 1.868 million, which is above expectations and levels seen a year ago. This indicates that though layoffs are still contained, it is possible that workers are taking longer periods to find new jobs. This could eventually impact labor market momentum if hiring demand slows down across key industries. This is a sign that analysts should look out for because it can reveal a lot about how steady claims data could be masking regional hiring shifts.
Further, regional data provide more insight into the differences in labor conditions. Claims have increased significantly in New York by 17,400, mainly driven by seasonal effects. Additionally, Michigan has experienced an increase of 4,400 claims, mainly driven by changes in the auto industry. However, the decline in Rhode Island and Oklahoma suggests that labor conditions have improved in these smaller regional labor markets. In light of this information, it seems that Paychex Inc. (PAYX) is undervalued, given that it offers services related to payroll processing, labor management, and small business hiring. Payroll processing and labor data solution providers generally benefit from an increase in small business hiring optimization. Analysts should focus on small business hiring trends, wage increases, and labor force participation rates. This information can provide insight on whether labor claims are increasing or declining.
ISM New Orders Point to Robust Demand in Both Manufacturing and Services Industries
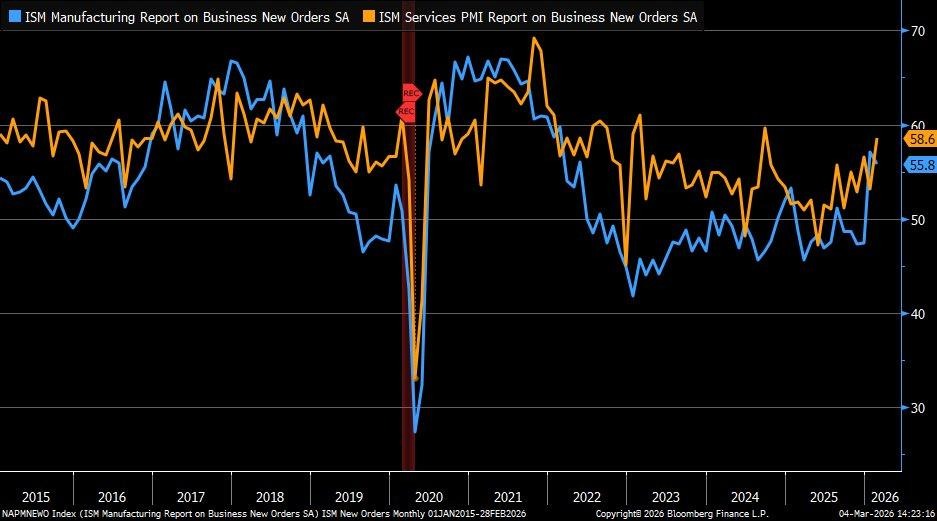
Economic indicators suggest that new orders in both manufacturing and services have continued to point to a situation where economic activities in these two key sectors of the economy are expanding. New orders in manufacturing stand at 55.8 in February 2026, though lower than January’s 57.1, are still in a state of expansion above the 50-point level. In the service sector, new orders have shown a substantial increase to 58.6 in February 2026 from 53.1 in January. At Zaye Capital Markets, we believe that these new order numbers are a key indicator of economic activities in the economy that are sustained by robust demand in various sectors of the economy and not just a single sector.
The new orders indices are also important indicators that economists and analysts consider because new orders often set the tone for future production, hiring, and capital expenditure decisions by companies. As new orders increase, companies react by stepping up factory production, service industry capacity, as well as hiring decisions to meet the rising demand for products and services. Although the small deceleration in the manufacturing new orders indicates that demand in the factory sector may be plateauing after the strong gains in the past few months, the strong improvement in the services new orders indicates that the economy’s underlying momentum remains strong. This balance in the economy indicates that stability in the economy may likely persist in the coming months. Analysts should also consider other factors such as the levels of inventories, supplier delivery times, as well as business intentions to determine whether new orders translate into higher production as well as business earnings in the coming months.
As such, under the prevailing conditions, Rockwell Automation Inc.’s (ROK) stock appears to be undervalued in light of the company’s strategic importance to the development of the global industrial automation industry as well as the development of the smart manufacturing ecosystem that is sweeping the world. As new orders remain strong, companies will likely invest in automation technologies to efficiently ramp up factory production while controlling costs. Rockwell Automation Inc.’s products include control systems, industrial software, as well as digital manufacturing solutions that allow factories to boost productivity as well as efficiency in operations. As such, analysts should consider the trends in manufacturing capital expenditure as well as factory automation investments in the country as well as globally to determine the implications of the prevailing new orders trends on the stock’s price in the coming months.
Micro Business Hiring Surge: An Indication of Labor Market Strength at the Grassroots Level
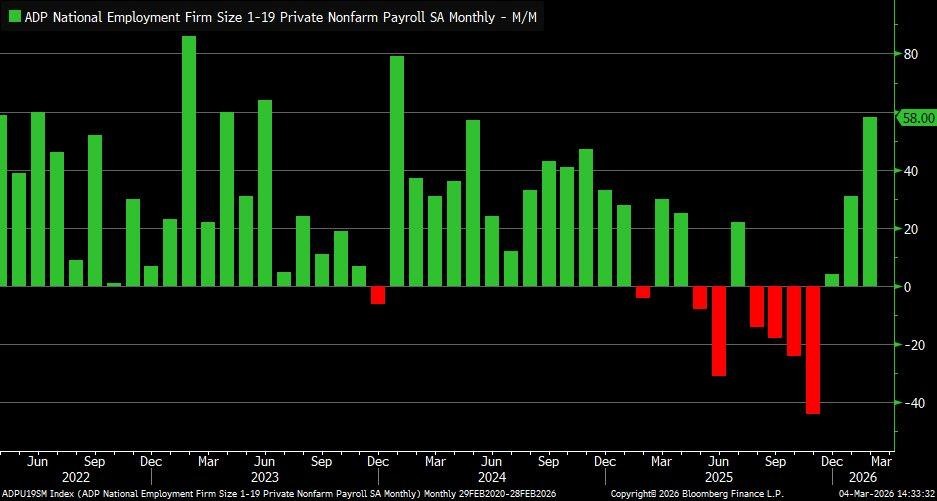
Recent employment data indicates that there has been a notable surge in hiring activities by micro businesses employing between one and nineteen workers. Micro businesses added 58,000 jobs during the month of February 2026, which is almost the entire 63,000 private sector jobs added during the same period. This is the third consecutive month of hiring activities for the smallest segment of the business landscape. At Zaye Capital Markets, we view this hiring surge as an important indication of grassroots level economic strength. This is so since micro businesses are usually highly sensitive to changes in the economy, and hiring activities within this segment indicate entrepreneurs’ confidence about demand conditions.
While hiring activities within the micro segment of the business landscape are on the increase, medium-sized businesses lost jobs during the same period, while hiring activities during the prior month were revised significantly lower. Another interesting fact is that wage growth for job-stayers in micro businesses has been rising by 2.6% on an annual basis, which is far below the average of 4.5%. This could be a sign that these businesses are effectively managing costs and still adding to their employee base. Analysts should look at hiring trends by business size, wage growth patterns, and small business confidence levels to determine if this hiring surge is a sign of a fundamental change in the labor market or a cyclical adjustment.
Considering these changes, it is our view that Intuit Inc. (INTU) is an undervalued stock given its high exposure to the financial infrastructure of small businesses. Intuit offers accounting software, payroll services, tax preparation services, and digital financial management tools to small businesses. With an increase in hiring by these businesses, it is likely that demand for these services will also increase. At Zaye Capital Markets, it is our view that analysts should look at rates of small business formation, employment growth rates of businesses with fewer than twenty employees, and digital accounting and payroll services adoption rates to determine if this hiring surge by micro businesses is a sign of sustained growth.
Upcoming Economic Events
Average Hourly Earnings, Retail Sales, Non-Farm Payrolls, Unemployment Rate
As we begin another crucial week for financial markets around the world, we are seeing a number of key economic events that could have a profound impact on how investors perceive economic growth and how interest rate policies could shape up in the coming months. Some of these key events include Average Hourly Earnings, Retail Sales, Non-Farm Payrolls, and Unemployment Rate. These events are key indicators of economic growth and are a crucial determinant of how economic growth is shaping up in the coming months. At Zaye Capital Markets, we are of the opinion that these events could have a profound impact on how economic growth is shaping up in the coming months. Here is a brief overview of how analysts should keep an eye on these events and how markets could react depending on whether these events are above or below expectations.
Average Hourly Earnings m/m
Average Hourly Earnings is a critical indicator of wage growth across the economy and often acts as an early signal of inflation pressure.
- If the actual reading comes in higher than the forecast, it would suggest stronger wage growth and increased consumer purchasing power. While this can support consumer spending and economic expansion, markets may interpret stronger wage growth as a potential inflation risk, which could strengthen the currency and push bond yields higher while creating pressure on growth-oriented equities.
- Conversely, if the actual number comes in below the forecast, it may signal easing wage pressure and a cooling labor market. This outcome could support equities sensitive to interest rates because slower wage growth reduces inflation concerns and may allow monetary policy to remain stable for longer.
Non-Farm Employment Change
Non-Farm Employment Change provides one of the most comprehensive monthly snapshots of labor market health by measuring the number of jobs added across the economy.
- If the actual number exceeds the forecast, it indicates strong hiring activity and economic resilience. Equity markets typically respond positively to strong employment growth because it reflects expanding business activity and stable consumer income. However, stronger-than-expected job creation can also reinforce concerns about persistent inflation if labor demand remains too tight.
- On the other hand, if job growth falls below expectations, markets may interpret this as evidence that economic activity is slowing. While this may weaken risk appetite in equity markets, it can also increase expectations for stable interest rates and support defensive sectors.
Unemployment Rate
The unemployment rate can give a clear picture of a balanced market.
- If the actual unemployment rate dips below the forecast, it indicates that demand for labor is still high and businesses are hiring at a steady rate. This can be a positive sign for market confidence and can bolster businesses that deal with consumers and depend on steady income. However, it can also indicate that wage pressures will continue to be high.
- If the unemployment rate increases above forecasts, it could indicate that demand for labor is weakening, which can negatively impact market confidence but can reduce inflation pressures at the same time. Analysts should look out for how unemployment rates and wage pressures are correlated because these two factors determine how the market can be stable.
Retail Sales m/m
Retail Sales are a measure of the total spending activity in the economy and are a key indicator of demand in the economy.
- If the number is higher than the forecast, it is a positive sign that consumers are confident and are spending well, and that is always a welcome sign in the market.
- If the number is lower than the forecast, it is a negative sign that consumers are losing confidence and are spending less, and that is a negative sign in the market.
Core Retail Sales m/m
Core Retail Sales are a measure of Retail Sales, excluding volatile segments like cars and fuel, and are a better indicator of Retail Sales because they are a measure of the total spending activity in the economy, apart from segments that are volatile in nature.
- If the number is higher than the forecast, it is a positive sign that the economy is still growing and that consumers are still spending well, and that is a welcome sign in the market because consumers are a key part of the economy and are responsible for a lot of the demand in the market.
- If the number is lower than the forecast, it is a negative sign that consumers are losing confidence and are spending less, and that is a negative sign in the market.
Stock Market Performance
Major Indexes Hold Near Recent Highs, But Underlying Drawdowns Reveal Fragile Breadth
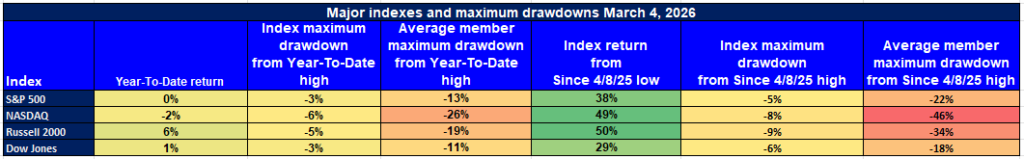
The stock market continues to demonstrate strength in its ability to sustain a powerful rally off the April 8, 2025 market low. Yet, year-to-date stock market performance for the major indexes continues to demonstrate mixed results. When analyzing deeper into the data, however, we find that the average stock within these indexes is experiencing much deeper drawdowns than the overall headline numbers reveal. At Zaye Capital Markets, we believe that this is a sign of a market environment where overall index stability is masking underlying volatility within individual stocks. While overall market indexes are holding close to their highs, overall breadth within the market remains stagnant, revealing a continued lack of participation within individual stocks.
The following is a breakdown of current stock market performance for the overall market indexes using current available data.
S&P 500: Stable Headline Performance, Weak Internal Breadth
YTD: 0% | 38% off April 2025 low | -3% from YTD high | Avg. member: -13%
The S&P 500 is holding flat in terms of overall year-to-date performance but is up 38% off the April 8, 2025 low. While overall headline numbers for the index reveal a mere 3% decline off its year-to-date high, the average member within the index is actually off 13% from its high and is down 22% from its level during the April rally.
NASDAQ: Strong Recovery Since April, But Severe Member Volatility
YTD: -2% | 49% off April 2025 low | -6% from YTD high | Avg. member: -26%
The NASDAQ continues to show the strongest recovery from its low in April. It is up 49% since then. However, the index itself is still down 2% YTD and is off 6% from its YTD high. Yet again, we want to point out that beneath the surface of the index itself, the average member is still down 26% from its high and is off 46% from its level in the April recovery period. Our point here is that we believe we are seeing continued volatility in growth stocks where leadership is dominated by a handful of large technology stocks.
Russell 2000: Small Caps Lead YTD, Yet Individual Stocks Still Lag
YTD: 6% | 50% off April 2025 low | -5% from YTD high | Avg. member: -19%
The Russell 2000 is showing the strongest YTD performance, up 6% and an incredible 50% from its low in April. While the index itself is off just 5% from its YTD high, the average member is off 19% from its high and is off 34% from its level in the April recovery period. Our point here is that while small-cap stocks are showing strength in terms of their index itself, individual stocks within that index are still lagging.
Dow Jones: Defensive Composition Limits Volatility
YTD: 1% | 29% off April 2025 low | -3% from YTD high | Avg. member: -11%
Dow Jones Industrial Average indicates a somewhat stable market with a 1% gain so far this year and a 29% increase since the April 2025 low. The Dow Jones has only declined 3% since its peak, indicating it is one of the more stable indices in today’s market. Yet, the average stock has decreased 11% since its peak and is still 18% below its value during the April recovery period. At Zaye Capital Markets, we still see the defensive nature of the Dow Jones Industrial Average providing relative stability compared to other indices.
As a whole, it is apparent that a disconnect between how indices are performing and how an average stock is doing indicates a market that still has limited leadership and underlying volatility. At Zaye Capital Markets, we continue to monitor market breadth and favor stocks with high earnings potential, robust financials, and a stable cash flow as investors go through a market where the performance of indices does not always accurately indicate market conditions.
The Strongest Sector In All These Indices
Energy Leads Year-To-Date, While Short-Term Gains Stay Selective
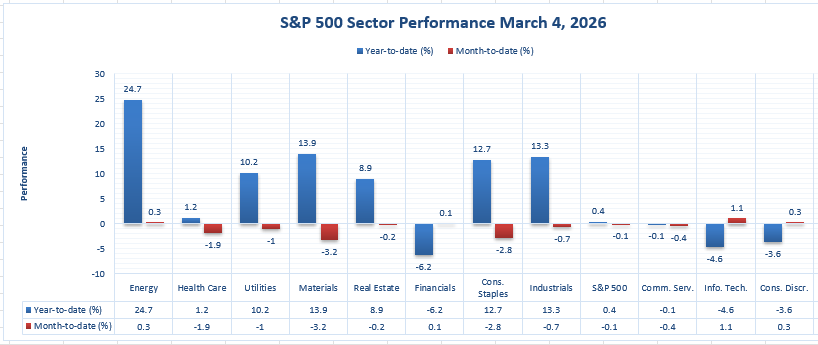
As we can see from the sector performance figures, the Energy sector has performed the best year to date, up 24.7 percent, making it the strongest sector on the board. This performance far outpaces the next best-performing sector, Materials, up 13.9 percent, and the next tier of sectors, including Industrials, up 13.3 percent, Consumer Staples, up 12.7 percent, Utilities, up 10.2 percent, and Real Estate, up 8.9 percent. The Health Care sector has performed just slightly higher, up 1.2 percent, and the benchmark has performed close to flat, up 0.4 percent. This, to us, represents a microcosm of the way in which we believe the overall stock market’s stability, or lack thereof, has been concentrated in certain sectors rather than broad-based.
The month-to-date performance of the sectors also illustrates this point in that only a handful of sectors have performed well, including Information Technology, up 1.1 percent, Energy, up 0.3 percent, Consumer Discretionary, up 0.3 percent, and Financials, up 0.1 percent. The remaining sectors have declined, including Health Care, down 1.9 percent, Utilities, down 1.0 percent, Materials, down 3.2 percent, Real Estate, down 0.2 percent, Consumer Staples, down 2.8 percent, and Industrials, down 0.7 percent, and the benchmark, down 0.1 percent.
What we believe will determine how this market behaves in the near term will be whether the 24.7 percent performance of the Energy sector can be matched by a more balanced performance of the remaining sectors, or whether the performance gap between the leaders and laggards will continue to be pronounced. This includes Financials, which has performed the worst, down 6.2 percent year to date, Information Technology, down 4.6 percent, Consumer Discretionary, down 3.6 percent, and Communication Services, down 0.1 percent.
Earnings
Yesterday’s Earnings Recap – March 5, 2026
- Merck KGaA – Full-Year 2025 results showed net sales of €21,102 million, representing a 0.3% year-over-year decline, although organic growth was positive at 3.1% after currency effects reduced reported growth. EBITDA pre reached €6,109 million, rising 0.6% from the prior year, while the EBITDA pre margin improved slightly to 28.9% from 28.7%. Profit after tax came in at €2,608 million, down 6.1% year-over-year. EPS pre was €8.34 compared with €8.63 in 2024, while reported EPS stood at €6.00 compared with €6.39 previously. In the fourth quarter of 2025, net sales were €5,249 million, down 3.1% year-over-year, while EBITDA pre reached €1,443 million and EPS pre was €1.88. Reported net income for the quarter was €319.2 million. The company proposed maintaining its dividend at €2.20 per share. For 2026, guidance indicates net sales between €20.0 billion and €21.1 billion and EBITDA pre between €5.5 billion and €6.0 billion, with EPS pre expected between €7.10 and €8.00 as generic competition impacts U.S. Mavenclad sales beginning March 2026.
- Kroger Co. – Fiscal fourth quarter and full-year 2025 results highlighted steady grocery demand and operational improvements. Fourth-quarter identical sales without fuel increased 2.4%, while total sales reached $34,725 million compared with $34,308 million a year earlier. Operating profit came in at $1,246 million. GAAP earnings per share were $1.35 compared with $0.90 in the prior year, while adjusted earnings per share reached $1.28 compared with $1.14 previously. For the full fiscal year, identical sales without fuel increased 2.9%. The company issued fiscal 2026 guidance for identical sales without fuel growth between 1.0% and 2.0%. Performance was supported by strong e-commerce expansion, continued pharmacy demand, and improved gross margins driven by operating efficiencies.
- Petroleo Brasileiro SA Sponsored ADR – The company reported results supported by strong operational performance across its offshore production portfolio. Full-year 2025 oil production reached approximately 2.4 million barrels per day, supported by strong export volumes and resilient offshore output. Market expectations ahead of the release suggested fourth-quarter earnings per share near $0.57 and revenue around $23.1 billion. The company’s adjusted EBITDA and net income remained supported by high production levels and disciplined capital investment despite oil price volatility. Strong cash flow generation continues to support shareholder distributions and dividend payments.
- Costco Wholesale Corporation – Fiscal second quarter 2026 results for the 12-week period ending early February 2026 reflected strong consumer demand and continued membership growth. Net sales reached $68.24 billion, representing a 9.1% increase year-over-year, while total revenue including membership fees reached $69.60 billion, up 9.22%. Net income increased to $2.035 billion compared with $1.788 billion in the prior year. Diluted earnings per share were $4.58 compared with $4.02 previously, exceeding consensus expectations. Comparable sales increased 7.4%, while comparable sales excluding fuel and foreign exchange effects rose 6.7%. Digitally enabled comparable sales increased 22.6%, and paid memberships reached approximately 82.1 million, highlighting continued expansion of the company’s subscription-driven retail model.
Today’s Earnings Preview – March 6, 2026
- Deutsche Lufthansa AG – Investors will focus on passenger demand trends, load factors, and revenue per seat as the airline reports results. Key metrics include ticket pricing power, international travel demand recovery, and cost management, particularly fuel expenses and labor costs. Market participants will also watch capacity expansion plans and profitability trends within cargo and long-haul routes to assess whether global travel demand continues strengthening.
- AltaGas Ltd. – The earnings release will provide insight into the stability of cash flows from natural gas infrastructure operations. Investors should monitor pipeline utilization levels, demand trends across energy distribution networks, and capital expenditure plans tied to long-term infrastructure development. Dividend sustainability and operating cash flow generation remain central metrics for evaluating the company’s long-term financial strength.
- Embraer SA Sponsored ADR – The aerospace manufacturer’s earnings are expected to highlight aircraft delivery numbers, order backlog strength, and defense segment performance. Investors will closely watch regional jet demand and the pace of commercial aircraft deliveries, as well as any updates on new aircraft programs. Defense contracts and service revenue remain key areas that support earnings stability across aerospace cycles.
- IMI plc – The industrial engineering group’s earnings will offer a view into global manufacturing demand and industrial investment trends. Investors should analyze order intake growth, operating margin performance, and exposure to sectors such as energy infrastructure and industrial automation equipment. Forward guidance regarding capital spending cycles across industrial customers will be particularly important in assessing demand momentum for precision engineering and control technologies.
Stock Market Overview – Friday, 6 Mar 2026
U.S. equity markets are trading with mixed momentum as investors continue to assess the latest labor market data, corporate earnings releases, and global economic developments. While the broader market remains relatively stable near recent highs, volatility persists beneath the surface as mega-cap technology stocks face valuation scrutiny after a strong rally through 2025. At Zaye Capital Markets, we observe that investors are increasingly selective, rotating capital toward sectors with stronger earnings visibility while reassessing positions in large technology companies that previously drove most of the market’s gains.
Stock Prices
Economic Indicators and Geopolitical Developments
Recent economic releases show the labor market remaining stable, with jobless claims holding near historically low levels and services demand continuing to expand. At the same time, investors remain sensitive to wage growth and inflation indicators that could influence monetary policy expectations. Energy markets and global trade developments also remain key drivers of sentiment, as fluctuations in oil prices and geopolitical tensions continue to shape investor positioning across industrial and energy stocks.
Latest Stock News
- $ICE | Intercontinental Exchange announced a minority investment in cryptocurrency exchange OKX, valuing the company at $25 billion. The move highlights increasing institutional involvement in digital asset infrastructure and reflects growing interest from traditional financial institutions in expanding into crypto trading ecosystems.
- $MSFT | Microsoft entered a strategic partnership with Chile’s state-owned mining company Codelco to deploy artificial intelligence across mining operations. The collaboration focuses on improving productivity, predictive maintenance, and operational efficiency using advanced AI systems.
- $GPS | Gap warned that tariffs are weighing on profitability, forecasting annual adjusted profit below analyst expectations. The company highlighted rising import costs and supply chain adjustments as key challenges affecting margins moving into the next fiscal year.
- $EXPE | Expedia shares surged after reports that artificial intelligence developers are scaling back plans to integrate direct travel booking into conversational AI platforms, easing fears that travel intermediaries could be bypassed by AI-driven booking systems.
- $BKNG | Booking Holdings rallied alongside other online travel companies following the same development, as investors reassessed the competitive risks posed by artificial intelligence platforms entering the travel booking market.
- $TRIP | Tripadvisor also gained as sentiment improved across the travel technology sector, with investors viewing the reduced AI-booking threat as supportive for existing travel marketplace platforms.
- $MET | MetLife confirmed the declaration of its first-quarter 2026 preferred stock dividend, reinforcing the company’s commitment to shareholder returns and consistent capital distribution in the insurance sector.
- $PTRN | Pattern Energy reported record financial results and announced a $100 million share repurchase program, signaling strong cash flow generation and management confidence in future earnings performance.
- $MANH | Manhattan Associates expanded its capital return strategy by increasing its share buyback program to $500 million, aiming to enhance shareholder value and support earnings per share growth.
The Magnificent Seven and the S&P 500

The “Magnificent Seven” — Apple, Microsoft, Nvidia, Amazon, Meta, Alphabet, and Tesla — remain the dominant force within the S&P 500. These companies have driven a large portion of the index’s gains over the past year, but recent trading shows increasing pressure as investors reassess valuations following their significant rally. When these stocks experience declines simultaneously, the broader index often weakens because these companies represent a substantial portion of total market capitalization. This concentration has contributed to periods where the S&P 500 appears stable while many individual stocks experience deeper corrections.
Major Index Performance as of Friday, 6 Mar 2026
- Nasdaq Composite: Trading at 23,031, reflecting ongoing volatility within large technology companies while semiconductor and artificial intelligence stocks remain closely watched.
- S&P 500: Trading at 6,932, remaining near record levels as investors balance strong corporate earnings against valuation concerns within mega-cap technology stocks.
- Russell 2000: Trading at 2,670, showing stronger participation among smaller companies as investors rotate toward domestically focused businesses.
- Dow Jones Industrial Average: Trading at 50,116, supported by strength in industrial and financial companies as investors shift toward companies with stable earnings and stronger balance sheets.
At Zaye Capital Markets, we believe the current market environment continues to favor selective positioning. While large-cap technology stocks remain influential, improving participation across sectors such as industrials, energy, and smaller companies will be necessary for a more durable market expansion. Investors should closely monitor market breadth, earnings revisions, and macroeconomic indicators as the next catalysts for market direction.
Gold Price: What Is Driving the Rise in Gold Prices in the Presence of the Risks of War and Economic Indicators?
Currently, the spot gold prices are trading around US $4,445/ounce. These prices are trading near historically elevated levels. However, the recent series of comments made on March 5 regarding the situation in the Middle East has reinforced the environment of heightened geopolitical risk. These comments included the situation in the Middle East, the destruction of naval assets, the continued strikes against strategic targets, and the discussions about the leadership structure in Iran. These discussions have elevated the overall risk environment in the global financial markets. However, the overall risk environment was further elevated by the discussions about gasoline prices rising without immediate intervention from the administration and the non-use of the strategic petroleum reserves. Although assurances were made about the Strait of Hormuz remaining open, which is an important route for the movement of oil globally, the overall environment of risk in the commodity markets was elevated. This is the time when the prices of gold attract more investments because of the overall environment of risk in the commodity markets.
In addition to the geopolitical factors, the traditional role of the overall macroeconomic environment in the gold investment universe has also continued. Yesterday’s labor statistics, which showed steady jobless claims and continued robust service sector demand, suggest that the overall economy is steady but not particularly robust. Such an environment is supportive of the gold price, as it does not remove the gold investment thesis while also leaving the overall monetary policy environment in a state of flux. In terms of the overall economic data scheduled to come out later today, investors are focusing on the following key statistics: **Average Hourly Earnings, Non-Farm Employment Change, Retail Sales, Core Retail Sales, and the Unemployment Rate**. Should the labor statistics come in stronger than forecast, it could suggest a further tightening in the overall financial conditions, which could place a short-term headwind on the gold price due to the higher opportunity cost of non-interest bearing assets. However, if the employment statistics come in weaker than forecast, it would further support the view that the overall economy is slowing, which is a traditional driver of gold demand due to the overall portfolio rebalancing effect. As a result, the interplay between the geopolitical environment, the energy markets, and the overall economic statistics continues to play a role in the overall support of the gold price at record levels.
Oil Prices: What Is Driving Oil Prices Higher Amid War Risks and Economic Data?
The price of Brent crude oil is currently trading at $82.99 per barrel, and West Texas Intermediate (WTI) oil is trading at $78.60 per barrel, as per the latest market data available as of 6th March 2026. The significant increase in oil prices is a result of the market’s rapid response to geopolitical risk, particularly in the Middle East region. The latest statements released on the 5th of March, indicating continued military operations against Iranian infrastructure, loss of naval assets, and the strategic campaign in the region, have introduced a risk premium into the market. Despite the latest statements by officials indicating the opening of the Strait of Hormuz, the market is extremely sensitive as this corridor carries a significant share of the world’s oil supply. Any perceived threat of a small chance of disruption of oil supply in this region results in oil prices increasing rapidly as supply security is uncertain. The latest signals indicating the strategic petroleum reserve will not be used to stabilize oil prices, along with other statements indicating oil prices may go higher without intervention, indicate policymakers may let the market absorb the shock rather than immediately acting to reduce oil prices. Conversations with policymakers and energy companies about possible market interventions, such as oil futures markets, indicate how closely oil prices are related to geopolitical risk and energy security policies.
Meanwhile, the macroeconomic environment is also influencing the demand side of the oil price equation. Yesterday’s economic data releases, such as steady jobless claims and the continued resiliency of the service sector, indicate that the overall economic environment is still moving forward, thereby sustaining the demand for oil as a source of fuel for transportation, logistics, and industrial purposes. If the overall environment for employment is still steady and the overall activity of consumers is still strong, then the overall demand for oil as a source of fuel should also remain strong, sustaining oil price movements, even if volatile. The upcoming releases of economic data today, namely Average Hourly Earnings, Non-Farm Employment Change, Retail Sales, Core Retail Sales, and Unemployment Rate, will play a major role in determining the short-term direction of oil price movements. Favorable releases of economic data, such as higher-than-expected employment growth, will indicate strong economic growth, sustaining the overall demand for oil as a source of fuel and further increasing oil price movements. On the other hand, if the overall economic data releases are lower-than-expected, it may indicate slowing economic growth, resulting in lower demand for oil as a source of fuel and putting pressure on oil price movements. Overall, the interplay of geopolitical events, overall demand for oil as a source of fuel, and the overall supply of oil will remain the major factors influencing oil price movements in the current overall financial markets environment.
Bitcoin Prices: What Is Driving Bitcoin Price Volatility in the Presence of Geopolitical Risks?
Bitcoin is currently trading near the $70,500 mark, which indicates that the asset is still highly volatile in nature but is backed by strong underlying support from the broader markets. The asset’s recent trading range indicates that the asset is stabilizing near the $70,000 support zone, which is increasingly being considered a key psychological barrier for the asset in the wake of the recent rally above $72,000. The overall trading scenario indicates that the asset is seeing fresh inflows in the wake of the spot Bitcoin ETF, with large-scale institutional product inflows into the asset leading the way in the recent trading scenario. The overall trading scenario in the Bitcoin ecosystem is indicating rising open interest in the asset’s futures contracts, which indicates that the asset is seeing rising institutional investor participation in the wake of the asset’s rising prices. The overall asset adoption scenario continues to support the asset’s underlying demand scenario, with fresh reports from the Latin American markets indicating rising asset adoption in the wake of the asset volatility and inflation pressures in the region.
Geopolitical events and macroeconomic factors are simultaneously influencing market sentiment in the cryptocurrency space. The series of geopolitical announcements made on March 5, relating to military interventions in the Middle East, ongoing strikes against Iranian interests, and overall geopolitical instability, have led to an element of uncertainty in global markets. Traditionally, geopolitical events and instability lead to an increase in the overall popularity of decentralized currencies such as Bitcoin, as some investors perceive such currencies as an alternative form of financial structure in the face of geopolitical instability. On the other hand, the overall economic data announced yesterday, relating to unchanged jobless claims and strong demand for services, indicates that global economic activity is still strong and healthy, and this is likely to influence market risk appetite positively. The overall economic data announced today, relating to Average Hourly Earnings, Non-Farm Employment Change, Retail Sales, Core Retail Sales, and the Unemployment Rate, is likely to play a crucial role in determining short-term market risk appetite and overall market sentiment. If economic data is strong, it is likely to confirm market expectations of a tightening of overall financial conditions, which may negatively impact the overall speculative inflow into cryptocurrencies such as Bitcoin. On the other hand, if economic data is weak, it is likely to confirm market expectations of overall financial conditions remaining supportive for risk assets, and this may encourage investors to diversify their portfolio and invest in cryptocurrencies such as Bitcoin.
Ethereum Prices: What Is Driving Ethereum Price Movements and Whale Activity Today?
Ethereum is currently trading at around $2,068, which indicates that the market is currently stable after the major price correction that was witnessed earlier in the year. As can be noted from the price movements, Ethereum is currently attempting to hold above the psychological support level of $2,000, which is now considered an important price level for the market. As can be recalled, Ethereum was trading above the $3,000 price level earlier in the year, but the current price movements indicate that the market is currently in the process of consolidation due to the volatility that is being witnessed in the broader cryptocurrency market. As indicated in the recent market analysis, the Ethereum market is currently being driven by the activities of institutional investors through the Ethereum-based exchange-traded funds, which have continued to witness periodic inflows. As indicated in the analysis, the periodic inflows into the Ethereum market through the ETFs indicate that the market is still being held up by the institutional investors, who have continued to view the market as an important long-term investment opportunity.
Further, on-chain data for the past week also indicates an increase in whale accumulation, and this has historically been a major factor in determining the price momentum of Ethereum. Large addresses with balances of tens of thousands of Ethereum have been observed moving funds from centralized exchanges to private storage wallets. This is generally perceived as a signal by market players that whales are planning to hold the asset for a longer period rather than planning to sell into the market. Therefore, when whales accumulate Ethereum and reduce supply on centralized exchanges, the overall supply of Ethereum available for trading on centralized exchanges reduces, and this may cause price volatility if demand for Ethereum increases. Additionally, it is also important to note that Ethereum’s price is also heavily correlated with the overall cryptocurrency market and other macroeconomic factors, and as such, Ethereum’s price is also likely to be affected by the overall risk environment of the global financial market, and as such, the overall cryptocurrency market is likely to remain a major factor determining Ethereum’s price direction in the near term.
