Where Are Markets Today?
European and US equity futures are opening slightly weaker on this Thursday morning as markets reassess technology valuations following mixed reactions to earnings results for key technology and semiconductor companies. Dow futures are down by 0.2%, S&P 500 futures are down by 0.2%, and Nasdaq 100 futures are down by 0.4% as of early morning hours. European stock market indices are reflecting the same sentiment and are expected to open slightly weaker as global markets open. The opening of the markets is slightly weaker due to concerns about the sustainability of growth assumptions for the software sector and the sensitivity of forward revenue guidance for these companies with very high valuations.
The reason for the weakness in the markets and the reassessment of technology valuations lies with the mixed reactions to earnings results for technology and semiconductor companies. Although Nvidia reported better-than-expected earnings and revenue for its latest quarter, its stock did not move much during after-hours trading. This shows that the market had already priced in these positive earnings surprises. On the other hand, Salesforce reported weaker-than-expected revenue for its 2027 fiscal year and saw its stock fall by 4% during after-hours trading. This shows concerns about the impact of artificial intelligence on the traditional enterprise software business model. The market is not concerned about the current earnings; it is concerned about the sustainability of growth assumptions for these companies.
The European futures are also subject to cross-Atlantic transmission effects and macro positioning related to the release of key economic data. Technology sector movements in the U.S. tend to influence the European semiconductor, software, and industrial technology space due to correlated institutional flows. However, traders are also positioning cautiously ahead of the U.S. weekly jobless claims data and the January producer price index data, which are due to influence U.S. interest rate expectations and real yield direction. High bond yields relative to last year are also continuing to influence the tolerance for valuation multiples, which is supporting the fragile equity market.
While the S&P 500, Nasdaq, and Dow Jones futures experienced significant cash session gains on Wednesday, rising by 0.8%, 1.3%, and about 0.6%, respectively, we believe the futures are continuing to reflect a market that remains selective rather than bullish. Based on our analysis at Zaye Capital Markets, we believe the pullback in the market today is likely due to a recalibration of the market due to valuation discipline, as opposed to any material change in the earnings fundamentals. We believe the next market impulse will likely come from the release of labor data, inflation data, and whether the upcoming earnings from Dell Technologies, CoreWeave, and Warner Bros. Discovery help reinforce the market’s confidence in the resiliency of AI infrastructure and enterprise technology.
Major Index Performance as of Thursday, 26 Feb 2026
- Nasdaq Composite: ~23,152.08 points, +1.26%, with the index rising today due to the strength in AI and technology-related stocks.
- S&P 500: ~6,946.14 points, +0.81%, with the index rising today, driven by the strength in the growth and AI infrastructure space.
- Dow Jones Industrial Average: ~49,482.27 points, +0.63%, with the index rising today, driven by the strength in the industrial and infrastructure space.
- Russell 2000: ~2,661.48 points, +0.34%, with the index rising today, albeit at a slower rate compared to the major indices.
The Magnificent Seven and the S&P 500
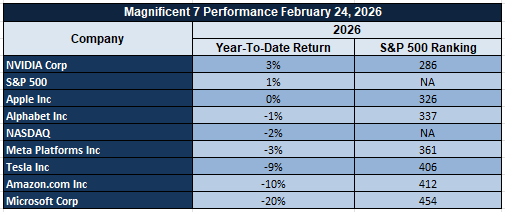
The Magnificent Seven — Nvidia, Microsoft, Apple, Amazon, Meta, Alphabet, and Tesla — continue to dominate index-level performance and remain the primary force behind the S&P 500’s resilience. Today’s gains in the Nasdaq and S&P 500 are heavily influenced by strength in AI-linked and infrastructure-exposed names, particularly Nvidia and Microsoft, as capital flows remain concentrated in companies tied to compute scalability, cloud monetization, and energy-backed data center expansion.
This concentration reinforces a structural theme: the S&P 500’s upward movement is being powered disproportionately by mega-cap technology rather than broad-based sector participation. While this leadership reflects strong earnings power and forward capital expenditure visibility within AI ecosystems, it also highlights fragility in market breadth. If momentum in these seven names stalls, index-level performance could decelerate rapidly given their weighting influence. Until leadership expands into financials, industrials, small caps, and cyclicals, the S&P 500 remains highly sensitive to sentiment shifts within this concentrated technology cohort.
Drivers Behind the Market Move – Thursday, February 26, 2026
As the US and European markets grapple with the complex interplay of corporate earnings recalibration, trade policy signals, and important macroeconomic data releases, investor sentiment remains guarded. The US and European futures are weaker this morning as markets absorb overnight news related to AI-driven earnings volatility, trade policy signals, and impending labor market data. The interplay between robust corporate earnings and rising geopolitical and policy-related uncertainties will shape market positioning today for equities, commodities, and currencies.
1. Renewed Trade Policy Signals and Tariff Authority Debate
Current trade policy signals and the debate over exploring alternative legal mechanisms to enhance tariff authority are rekindling trade-related uncertainties for the markets. Criticism of judicial rulings on tariffs and a warning to other nations not to exploit legal constraints suggest that trade policy may undergo recalibration. Although the overall economic backdrop points to declining inflation and improving domestic growth, the markets are influenced by the inflationary and supply chain implications of re-establishing baseline tariff levels. Export-oriented industries and sectors in Europe and US multinational technology and industrial stocks are more responsive to trade policy-related news and are causing volatility in these sectors and industries globally.
2. Geopolitical Tensions and Energy Risk Premium
Fresh sanctions related to the situation in Iran, as well as clear statements regarding the military options that could be taken in the event of further escalation, continue to maintain the geopolitical risk premium in the markets. Despite the fact that diplomacy has been cited as the preferred policy path forward, the energy markets continue to be sensitive to the risk of potential supply chain disruptions. The recent price movements in the oil markets continue to be anchored in the recent trading ranges as traders continue to price in both the overall surplus in the global energy supply as well as the geopolitical risk premium. The European markets continue to reflect a cautious tone in the equities space as a result of the overall exposure to the energy import risk, while the overall performance of the U.S. energy sector continues to reflect a relatively strong position.
3. Labor Data and Central Bank Communication in Focus
Markets continue to position in anticipation of the upcoming unemployment claims data in the United States, as well as the overall commentary that is likely to emerge from the European Central Bank. Labor data continues to play a critical role in the determination of the overall rate environment, particularly in the growth space as well as the technology sector. A weaker-than-expected unemployment claims data could serve to heighten overall concerns regarding the overall growth environment, while better-than-expected data could serve to reinforce the overall rate environment as being higher for longer. Given the fact that the inflation trajectory as well as the rate environment is critical to the overall stability in the markets, the data that is being released today is serving to maintain a relatively cautious tone in the futures space as investors await the overall confirmation that the data releases provide to the markets.
In conclusion, the overall situation that is being driven by the recent trade recalibration signals, the geopolitical risk premium, as well as the data-driven rate expectations continues to serve as the backdrop for the relatively cautious tone that is being reflected in the markets today as investors continue to grapple with the overall policy uncertainty that is being driven by the relatively strong corporate fundamentals that continue to be reported in the markets.
Digesting Economic Data
The TRUMP Tweets and Its Implications
The messaging around the economy, which occurred on February 25, emphasized the “dawn of a new golden age,” with a focus on inflation rates, mortgage and gas prices, the enforcement of border security, and the historic turnaround of the country. The overall narrative is attempting to instill a sense of confidence in the economic cycle, which includes production, labor, and consumers. For the markets, the overall narrative is attempting to instill a sense of confidence in the economic cycle, which includes the durability of the growth cycle and the ability to manage the economy. However, the rhetoric alone is not enough to offset the overall macroeconomic risks, and the markets will continue to be sensitive to the overall inflation and labor reports, which must validate the overall turnaround story.
The authority and ability to manage trade, including tariffs, was a significant component of the overall messaging. The ability to criticize the Supreme Court’s recent tariff decision and the intent to explore alternative avenues is creating trade uncertainty. Although the intent is to protect the country’s sovereignty and workers, the markets generally interpret the ability to expand tariff authority as a potential inflation and growth risk. However, the overall policy is attempting to protect the country, which may result in a bifurcated response in the markets. The overall policy may be beneficial to some sectors, which may result in a selective response in the markets.
The geopolitical posture regarding Iran has added yet another risk premium to the macro environment. While diplomacy was clearly stated to be the preferred course of action, the clear recognition of the military option remaining on the table, along with the announcements of fresh sanctions, clearly sustains the geopolitical risk environment for energy and global risk assets. Historically, this positioning has been beneficial for commodities such as oil via the supply risk route while sustaining volatility within equities and emerging markets.
Lastly, the infrastructure and AI-related policy announcements clearly have structural implications for the US. The invitation of AI and data center executives to discuss the build-out of power generation infrastructure by the larger technology companies and pushing back on international data sovereignty regulations clearly signals a policy approach centered on technology dominance and capacity expansion within the US. In addition to this rhetoric regarding growth within the energy production sphere and record-high exports of LNG, the Administration clearly has a policy approach centered on the build-out of infrastructure within the themes of energy, AI, and infrastructure. The clear policy approach will be beneficial for capital expenditure cycles within energy and technology-related infrastructure and will maintain the backdrop of trade complexities and regulations.
Volatility Averages Remain Below Long-Term Norms, Easing Risk Premiums
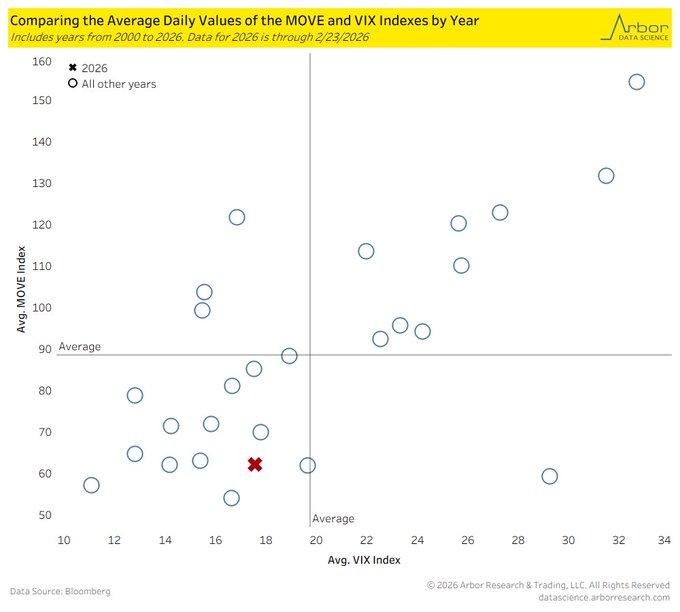
Year-to-date volatility levels continue to trend below their long-term historical norms. We believe this supports the notion that the overall environment is less volatile than the average investor perceives. Fixed income volatility levels, as recorded in the bond market, continue to trend well below the multi-decade average daily volatility. Equity volatility levels also continue to trend below their long-term norms. We believe that the average investor perception of volatility is skewed by the way in which they process information. Volatility levels that trend below their norms compress risk premiums, reducing the cost of risk hedging while encouraging overall asset allocation into equities and credit products.
Overall stability in the markets has several implications for the flow of capital. When volatility levels in both the bond market and the publicly traded equities space trend below their norms, portfolio managers tend to allocate more heavily to cyclical equities, structured credit products, and dividend-paying equities. We believe that the overall stability in the markets should be carefully monitored by analysts. We recommend that analysts pay close attention to credit spreads, options risk premiums, overall market conditions, and rate-sensitive sectors as a means of gauging the onset of any changes in the overall environment. Any changes in the volatility levels in the bond market could quickly cascade throughout the publicly traded equities space via changes in the overall discount rate.
With this in mind, we believe that BlackRock, Inc. (BLK) is undervalued in the overall environment driven by the stability in the flow of funds. We believe that the company benefits from the overall environment in that it is a global asset management company that benefits from the overall trend of equities and fixed income products in the overall environment. We recommend that analysts pay close attention to overall net asset flows as a means of gauging the overall trend in the environment.
Corporate Guidance Index Remains Elevated, Reinforcing Earnings Visibility
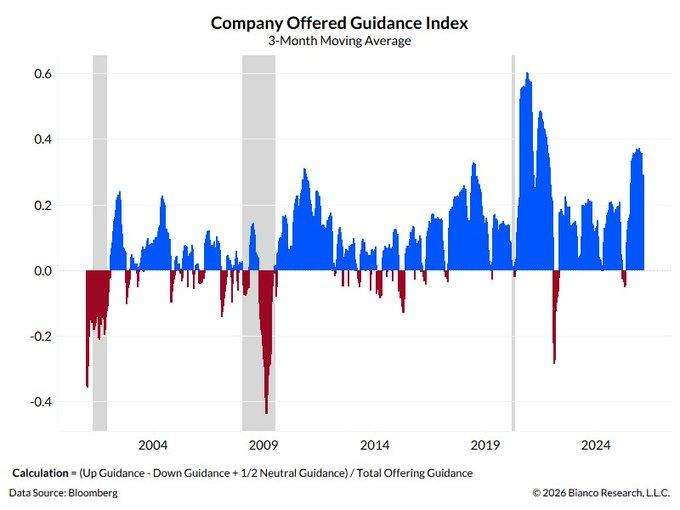
We note that the Company Guidance Index, which reflects the net balance of changes in corporate earnings guidance, continues to be strong and above its long-term average. The three-month moving average has been in an expansive range since the start of 2022 and reached historically high levels in late 2024. This indicates that more companies are issuing upward or stabilizing guidance rather than downward guidance. Historically, this indicator has been an early economic cycle indicator. It has fallen sharply in the past in the event of a recession as corporate visibility has declined. The current reading is in stark contrast to its behavior in the past during economic downturns. We believe that the consistency of the Company Guidance Index supports the notion that the resilience in earnings is not anecdotal but rather data-driven. When corporate management teams maintain a positive guidance outlook, the overall stock market benefits from improved earnings visibility and lower risk premiums. Positive guidance also supports capital expenditures, dividend policies, and share buybacks that sustain shareholder return mechanisms. We believe that analysts should pay close attention to the overall breadth of the guidance index strength by sector, the difference in guidance between cyclical and non-cyclical industries, as well as the relationship between revenue growth and margin sustainability. A decrease in the overall breadth of the guidance index could be an early sign of potential inflection points in the economy before earnings start to decline.
In the backdrop of the overall guidance index being in an expansive range, we believe that Eaton Corporation plc (ETN) is undervalued in the context of the earnings confidence cycle. ETN has exposure to the overall trend in corporate spending driven by electrification, infrastructure spending, and industrial demand. We believe that analysts should pay close attention to the company’s order backlog as well as its margin discipline to determine if the overall optimism in the corporate sector continues to sustain earnings growth.
Energy Executives Budget Conservatively, Signaling Supply Discipline
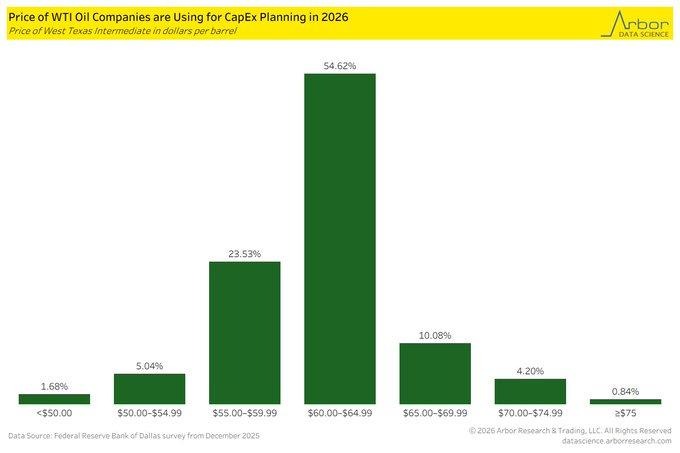
We observe that the majority of energy executives budget 2026 capital expenditure plans based upon West Texas Intermediate crude oil assumptions in the range of $60 to $64 per barrel. Spot prices are trading in the aforementioned range, with futures slightly below. Such planning assumptions reflect a degree of cautious optimism. We believe the clustering around mid-cycle oil prices suggests that energy companies are more focused upon maintaining balance sheet and shareholder returns rather than pursuing supply growth. The overall tone of the survey suggests an environment with elevated costs and subdued activity, consistent with a disciplined approach to capital allocation in the upstream energy sector.
We believe the conservative budgeting process within the energy sector has significant macroeconomic implications. When capital expenditure is budgeted based upon a moderately priced oil environment, supply growth is less likely to respond to an unexpectedly strong demand environment. The overall shift within the energy sector toward free cash flow generation, versus production maximization, suggests a less elastic supply response. Analysts should monitor rig counts, drilling productivity, and service cost inflation to better understand the extent to which supply growth is capped. Inventory levels and global demand trends will be key indicators in determining the extent to which supply constraints, within the domestic energy sector, may result in oil price volatility.
We believe ConocoPhillips (COP) is an undervalued company within the energy sector, based upon the company’s conservative budgeting process and low-cost asset base. The company’s portfolio efficiency allows it to generate strong cash flows at mid-$60 oil prices, consistent with the overall budgeting process within the energy sector. We believe the company’s emphasis upon shareholder returns, while maintaining production resiliency, is an attractive position in the event supply growth is capped. Analysts should monitor operating cost trends, production revisions, and cash return policies in determining the extent to which the company may benefit from an environment in which supply growth is less responsive to an unexpectedly strong demand environment.
Upcoming Economic Events
ECB President Lagarde Speaks, Unemployment Claims
With the trading week advancing further into the week, the macroeconomic events scheduled for the day feature two high-impact events that could reshape the risk appetite in the global economy. The macroeconomic events scheduled for the day could provide investors with the much-needed information regarding the direction of monetary policy in the European economy while also helping them understand the condition of the labor market in the United States. The reaction of the global economy to the macroeconomic events scheduled for the day would be determined by the extent to which the actual data differs from the forecast data.
ECB President Lagarde Speaks
Communication from the European Central Bank continues to be one of the most significant macroeconomic events that determine the price movements in the European economy.
- Any hawkish tone in the communication from the European Central Bank could lead to higher bond yields in the European economy, a higher value of the Euro, as well as pressure on the European equity markets, especially the property sector. Financial institutions may benefit from higher yield spreads.
- On the other hand, if the Fed takes a dovish stance by emphasizing disinflation progress, softening growth momentum, and/or considering further easing measures, it may negatively impact the value of the Euro, cause bond yields to dip, and favor growth-oriented equities. Analysts should be particularly careful with forward guidance rhetoric, inflation path comments, and balance sheet normalization hints.
Unemployment Claims
Weekly unemployment claims are one of the most timely measures of labor market stability and consumer income sustainability.
- Analysts should watch for a lower-than-forecast unemployment claims reading to further confirm the notion of stable labor markets and labor conditions, which should bode well for consumer spending and cyclical equities. However, if labor markets are stronger than expected, it may reduce the likelihood of rate cuts and push up bond yields.
- On the contrary, if unemployment claims are higher than expected, it may cause equities to go defensive since rising unemployment claims may be the first sign of weakening labor markets. In this scenario, bond yields may dip due to safe-haven demand, and defensive equities like healthcare and utilities may outperform. Analysts should be careful to look beyond the headline unemployment claims and consider the four-week moving average to gauge whether the change is merely volatility or the start of a trend.
Stock Market Performance
Indexes Stabilize Year-to-Date, but Internal Drawdowns Remain Elevated

Equity markets are showing measured resilience in early 2026, yet a closer look beneath the surface reveals that internal volatility remains materially higher than headline index returns suggest. While year-to-date performance across major benchmarks is modestly positive in several cases, average member drawdowns indicate that market participation is uneven and recovery remains selective rather than broad-based.
Here is our breakdown based strictly on the latest reported figures:
S&P 500: Stable Headline, Deeper Member Pressure
YTD: +1% | Max YTD drawdown: -3% | Avg. member max drawdown YTD: -12%
Since 4/8/25 low: +38% | Max drawdown since: -5% | Avg. member: -22%
The S&P 500 is up 1% year-to-date, reflecting surface-level stability. However, while the index itself only experienced a -3% maximum drawdown from its YTD high, the average constituent fell as much as -12%. Since the April 8, 2025 low, the index has rebounded 38%, yet the average stock still shows a -22% maximum drawdown in that same period, underscoring concentrated leadership dynamics.
NASDAQ: Strong Recovery, But Sharp Internal Swings
YTD: -2% | Max YTD drawdown: -6% | Avg. member max drawdown YTD: -25%
Since 4/8/25 low: +50% | Max drawdown since: -8% | Avg. member: -46%
The NASDAQ is down 2% year-to-date, despite staging a 50% rally from the April low. Its maximum YTD drawdown stands at -6%, but the average member experienced a far steeper -25% pullback. Since the April trough, while the index posted significant recovery, the average stock endured a -46% maximum drawdown, highlighting persistent volatility within growth segments.
Russell 2000: Positive YTD, Fragile Participation
YTD: +7% | Max YTD drawdown: -5% | Avg. member max drawdown YTD: -17%
Since 4/8/25 low: +51% | Max drawdown since: -9% | Avg. member: -34%
The Russell 2000 leads on a year-to-date basis with a 7% gain and a 51% rise from the April low. However, its average member’s maximum YTD drawdown of -17% and -34% since the April low reveal that small-cap volatility remains embedded beneath the index-level rebound.
Dow Jones: Modest Gains with Relative Containment
YTD: +2% | Max YTD drawdown: -3% | Avg. member max drawdown YTD: -10%
Since 4/8/25 low: +31% | Max drawdown since: -6% | Avg. member: -18%
The Dow Jones is up 2% year-to-date and has advanced 31% from the April low. Its -3% YTD drawdown suggests relative containment at the index level, yet the average member experienced a -10% peak decline and -18% maximum drawdown since April, reflecting ongoing stock-level dispersion.
At Zaye Capital Markets, we interpret this data as a reminder that index resilience does not equate to uniform recovery. Breadth, dispersion, and average member drawdowns remain critical indicators for assessing the durability of this cycle.
The Strongest Sector In All These Indices
Energy is the strongest sector on a year-to-date basis.
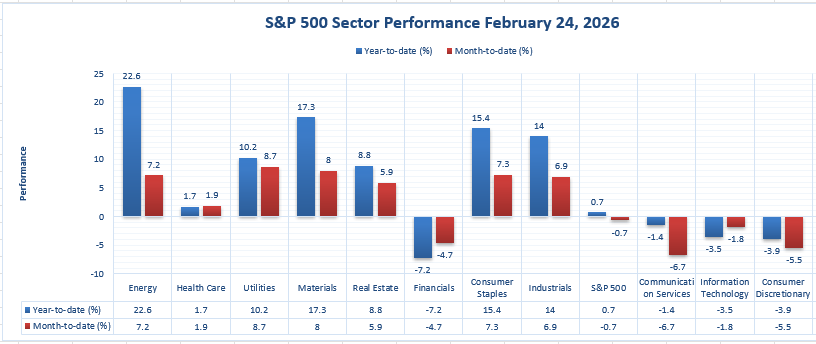
While the S&P 500 Index itself is only up 0.7% on a year-to-date basis, and down -0.7% on a month-to-date basis, the Energy sector is up 22.6% on the year and 7.2% month-over-month. That is a pretty significant spread. It indicates that the sector leadership we are seeing is not driven by the ‘average’ stocks in the market, but rather by the ‘outperformance’ stocks.
In terms of momentum within the current month, Utilities is the strongest sector on a month-to-date basis at 8.7%, narrowly beating Materials at 8.0%, and Utilities also has the second highest year-to-date return at 10.2%, just behind Materials at 17.3%. Consumer Staples is also quite strong at 7.3% month-to-date and 15.4% on the year, while Industrials is at 6.9% month-to-date and 14.0% on the year. In our view, the strongest ‘all-weather’ sector leadership is the Energy sector because it has the highest year-to-date return at 22.6%, and it also has the highest month-to-date return at 7.2%.
The flip side of the chart also shows us the strength of the sector leadership. Notice how many of the other sectors are down on the year, and also down on the month. Financials are down -7.2% on the year and -4.7% on the month. Communication Services are down -1.4% on the year and -6.7% on the month. Information Technology is down -3.5% on the year and -1.8% on the month. Consumer Discretionary is down -3.9% on the year and -5.5% on the month.
Earnings
Yesterday’s Earnings – February 25, 2026
February 25 was an important day in the earnings season, with results reported across the spectrum of AI infrastructure, aerospace components, quantum computing, consumer retail, combat sports entertainment, and global football commercialization.
- NVIDIA Corporation reported revenue for fiscal Q4 2026 of $68.1 billion, an increase of 73% over the same period in the previous year, primarily driven by Data Center revenue of $62.3 billion, an increase of 75%. EPS was reported at $1.76 per diluted share, according to the company. Revenue for fiscal 2026 was reported at $215.9 billion, an increase of 65%, with full-year GAAP EPS reported at $4.90.
- TKO Group Holdings reported revenue for Q4 2026 of $1.038 billion, an increase of 12% over the same period in the previous year. Net income was reported at $0.8 million, an improvement over the $60.9 million net loss reported in the previous year. Adjusted EBITDA was reported at $281.2 million. Revenue for fiscal 2025 was reported at $4.735 billion, with net income reported at $546.2 million and Adjusted EBITDA reported at $1.585 billion.
- IonQ reported revenue for Q4 2026 of $61.9 million, an increase of 429% over the same period in the previous year, with EPS reported at $2.13. Revenue for fiscal 2025 was reported at $130.0 million, an increase of 202%, with the company reporting a net loss for the fiscal year of -$510.4 million and EPS reported at -$1.82. The company reported strong liquidity with $3.3 billion in cash and investments.
- HEICO Corporation Class A reported net sales for fiscal Q1 2026 of $1,178.6 million, an increase of 14%. Operating income grew 15% to $259.9 million with an operating margin of 22.1%. Net income for the period came in at $190.2 million, an increase of 13%. Diluted EPS came in at $1.35 compared to $1.20. Aerospace market conditions and margin discipline remain key drivers.
- TJX Companies reported net sales for fiscal Q4 2026 of $17.7 billion, an increase of 9%. Comparable sales grew 5%. Net income came in at $1.8 billion. Diluted EPS grew 28% to $1.58. Revenue for fiscal 2026 came in at $60.4 billion, an increase of 7%. Net income came in at $5.5 billion with diluted EPS at $4.87.
- Manchester United Plc reported total revenue for fiscal Q2 2026 of £190.3 million, a decrease from £198.7 million year-over-year. However, Adjusted EBITDA grew to £76.0 million from £70.5 million year-over-year. Operating profit grew to £19.6 million from £3.1 million year-over-year. For the first half of fiscal 2026, Manchester United Plc reported an operating profit of £32.6 million compared to a loss. Cash reserves stood at £44.4 million.
Today’s Earnings – February 26, 2026
Today’s companies operate in enterprise infrastructure, digital assets, consumer software, hospitality, energy mining, banking, industrial automation, telecom, pharmaceuticals, and insurance sectors. This provides a wide macro view of the overall market.
- Dell Technologies will be analyzed based on enterprise hardware demand, server unit shipment assumptions based on artificial intelligence workloads, storage margin assumptions, and enterprise backlog.
- However, CoreWeave will still be central to the monetization of AI infrastructure. The earnings scalability will be influenced by the capacity utilization of GPUs, contract durations, and capital intensity.
- Intuit provides a window into the durability of the subscription model in the tax and small business markets. Revenue growth, retention, and margin expansion continue to be core drivers.
- MARA Holdings and TeraWulf will be looked at in terms of the efficiency of mining output, energy costs, and balance sheet flexibility in the face of digital asset volatility.
- Celsius Holdings provides a window into the branded beverage business, including growth and margin trends in the face of competitive pressures.
- DiamondRock Hospitality will be looked at in terms of trends in hotel occupancy rates, average daily rates, and revenue per available room.
- Financial results from Toronto-Dominion Bank and Royal Bank of Canada will be looked at in terms of the stability in net interest margin, credit trends, and loan growth.
- Schneider Electric, UCB, Deutsche Telekom, and AXA will be providing updates in the industrial automation business, the pharma pipeline, the telecom business, and the life insurance business, respectively.
The theme for the day remains the same: margin, durability, and the overall direction and tone in the company’s forward guidance.
Stock Market Overview – Thursday, 26 Feb 2026
The US stock markets have opened with selective gains as the investors are trying to digest the strong news flow of AI-driven corporate developments, infrastructure expansion plans, and earnings growth. The markets are showing strong gains in the top technology and AI infrastructure companies, while the rest are lagging behind. The markets are showing the signs of a capital cycle that is driven by compute, semiconductor fabrication, and energy supply constraints. At Zaye Capital Markets, we are trying to understand the sustainability of the AI-driven growth in the markets or not.
Stock Prices
Economic Indicators and Geopolitical Developments
The markets are trying to digest the AI capital expenditure acceleration plans with the ongoing geopolitical developments in the markets. The markets are showing the strong growth in the semiconductor industry due to the dedicated AI data center power agreements. The markets are trying to understand the energy availability as the major constraint for AI growth. The markets are also showing the strong growth in the labor data and the rate sensitivity in the markets.
Latest Stock News
- $NVDA | Nvidia continues to be the epicenter of the AI capital expenditure cycle. The company has announced that it has shipped its first Vera Rubin samples and is on track for production shipments in the second half of this year. The company has also highlighted that “physical AI” is now generating more than $6B in FY26 revenue and that this trend of monetizing AI is now moving from just training workloads into deployment use cases. The company has also highlighted that AI has now reached an inflection point where tokens are now productive for customers and profitable for cloud providers, turning their data centers into “AI factories.” The company is now expecting an increase in AI-driven capital expenditures of ~$4T by 2030 and is generating ~$500M in daily profits. The focus now is on the sustainability of demand from hyperscalers and the potential threat of AMD’s Helios platform.
- $MSFT | The recent 30% decline in Microsoft’s stock has led investors to question its valuation, but operationally, the company is in a great position. The company is now on track to generate ~$17B in operating profits per month by 2028, more than 10x its operating profits a decade ago, and is now available at a near decade-low multiple relative to its growth expectations. The current discount is due to multiple compression and not a decline in operating profits.
- $META | Meta AI reported around ~23M visits in January, a new traffic record. Though lower than standalone AI sites, the structural advantage is that Meta can embed AI into its ~4B-user ecosystem across its social and messaging products. This increases engagement, the accuracy of ad targeting, and efficiency in monetization. Investors are analyzing whether it increases revenue per user while maintaining stability in operating margin.
- $UBER | Uber partnered with Joby Aviation on the launch of Uber Air, which will allow users to book electric flights with one tap. The flights are expected to start later this year in Dubai. Uber retains the interface layer while avoiding the risk of aircraft manufacturing. With this, Uber maintains the central position in the next-gen mobility market. Joby shares rose above the $10 mark after the announcement.
- $ODD | Shares in ODD fell by more than 40% after the company revealed that it expects Q1 revenue to fall by 30%, compared to expectations of 21% growth. This was due to increased customer acquisition costs due to algorithmic changes. This shows the vulnerability of the distribution model, especially with the increasing customer acquisition costs.
- $TSM | TSM’s Arizona fabrication project covers ~1,100 acres and is expected to cost ~$165B. This is one of the largest semiconductor infrastructure investments of the decade. This shows the significance of reshoring and supply chain diversification due to geopolitical tensions. Investors are interested in the capital investment, yield ramp, and RoIC.
- $SMCI | Super Micro and VAST Data partnered to launch the enterprise AI platform jointly, along with Nvidia. This partnership aims to make the deployment of the AI factory easier. This shows the shift from selling at the GPU level to selling at the rack and data center levels.
- $AMD | AMD is investing $150M in Nutanix shares in a strategic partnership to create an open enterprise AI platform, optimized for EPYC CPUs and Instinct GPUs. The partnership extends beyond the CPU-GPU arena and helps AMD in the enterprise AI space. Competition with Nvidia’s integrated solution is an important aspect.
- $PATH | Shares in UiPath fell after the acquisition of Vercept by Anthropic to boost “computer use” capabilities in the Claude AI model. Agentic AI with the ability to execute multi-step workflows within live applications poses an additional, albeit small, threat to robotic process automation. Market participants are considering the long-term risk to enterprise automation displacement.
- $AMZN | Amazon, alongside Alphabet, Meta, Microsoft, Oracle, and OpenAI, is expected to enter into an agreement to build a dedicated power supply solution for AI data centers. The AI capital cycle is now inextricably linked with the development of new energy infrastructure, which is increasingly becoming the key driver for the development of computing infrastructure, with energy procurement now a key competitive advantage.
The Magnificent Seven and the S&P 500

The Magnificent Seven — Nvidia, Microsoft, Apple, Amazon, Meta, Alphabet, and Tesla — continue to dominate index-level performance and remain the primary force behind the S&P 500’s resilience. Today’s gains in the Nasdaq and S&P 500 are heavily influenced by strength in AI-linked and infrastructure-exposed names, particularly Nvidia and Microsoft, as capital flows remain concentrated in companies tied to compute scalability, cloud monetization, and energy-backed data center expansion.
This concentration reinforces a structural theme: the S&P 500’s upward movement is being powered disproportionately by mega-cap technology rather than broad-based sector participation. While this leadership reflects strong earnings power and forward capital expenditure visibility within AI ecosystems, it also highlights fragility in market breadth. If momentum in these seven names stalls, index-level performance could decelerate rapidly given their weighting influence. Until leadership expands into financials, industrials, small caps, and cyclicals, the S&P 500 remains highly sensitive to sentiment shifts within this concentrated technology cohort.
Major Index Performance as of Thursday, 26 Feb 2026
- Nasdaq Composite: ~23,152.08 points, +1.26%, with the index rising today due to the strength in AI and technology-related stocks.
- S&P 500: ~6,946.14 points, +0.81%, with the index rising today, driven by the strength in the growth and AI infrastructure space.
- Dow Jones Industrial Average: ~49,482.27 points, +0.63%, with the index rising today, driven by the strength in the industrial and infrastructure space.
- Russell 2000: ~2,661.48 points, +0.34%, with the index rising today, albeit at a slower rate compared to the major indices.
At Zaye Capital Markets, we believe the environment is now structurally AI-driven, energy-scarce, and increasingly capital-intensive. The industry is dominated by a small number of strong participants. The extent to which the broader universe participates and the overall earnings strength in the broader universe, excluding AI, will be key in determining whether the rally is more than a short-term phenomenon.
Gold Price: How Do Tariff Signals, Labor Data, and Geopolitics Impact Gold Prices Today?
Spot gold is currently trading near **US $4,880 per ounce** as of Thursday, 26 February 2026, holding elevated levels after recent volatility. The metal is recalibrating amid a combination of strong political messaging and incoming macroeconomic data. Statements emphasizing economic strength, falling inflation, lower mortgage rates, and energy expansion would ordinarily reduce immediate safe-haven demand; however, renewed tariff authority signals, criticism of court rulings on trade, fresh Iran-related sanctions, and the reaffirmation that military options remain available introduce policy uncertainty into global markets. Gold historically responds not only to outright crisis, but to uncertainty in trade policy, geopolitical positioning, and sovereign decision-making frameworks. Additionally, upcoming U.S. unemployment claims data and ECB communication act as near-term catalysts. A higher-than-forecast unemployment claims figure would typically weaken the dollar and compress real yields, reinforcing bullion demand as a hedge against economic slowdown. Conversely, a stronger labor print could lift yields and momentarily pressure gold through opportunity-cost dynamics. Central bank tone around inflation persistence and rate direction will further shape cross-currency flows into precious metals.
Yesterday’s economic tone, characterized by resilient corporate earnings in select sectors alongside concentrated equity leadership, has reinforced a bifurcated sentiment environment. While technology-linked equities display strength, geopolitical friction, tariff recalibration efforts, and sanctions developments sustain a layer of defensive positioning across portfolios. When equity rallies are narrow and policy uncertainty remains elevated, gold often benefits from allocation diversification rather than outright panic buying. The ecosystem influencing gold currently includes real yield direction, U.S. dollar trajectory, global trade policy risk, and central bank guidance expectations. In this environment, bullion remains sensitive to labor market surprises and rate path recalibration. As long as tariff frameworks, geopolitical negotiations, and rate expectations remain fluid, gold’s positioning near current highs reflects hedging demand embedded within broader portfolio construction strategies rather than isolated speculative flows.
Oil Prices: How Do Tariff Policy, OPEC, and Economic Data Impact Oil Prices Today?
The current price of crude oil is hovering at US $65-66 per barrel for WTI crude oil, while the price of Brent crude oil is trading at US $70-71 per barrel as of Thursday, 26 February 2026. Recent oil price movements are the result of the Iran-related sanctions, the message conveyed by the United States that it is ready to go to war, and the diplomatic situation in the Middle East. All of this indicates the geopolitical risk premium that is currently embedded in the oil price. However, the recent energy dominance, record levels of energy exports, and increases in domestic oil production also provide a counterbalance to the oil price movements. OPEC’s efforts to manage oil production, along with the International Energy Agency’s projections of the possibility of oil supply surpluses in early 2026, are creating downward pressure on oil prices. However, the recent commentary from energy-focused market news feed indicates that the supply buffers are sufficient, and the geopolitical situation is preventing oil prices from falling. Hence, oil is not rising due to higher demand; instead, it is trading within a volatility band.
This economic environment of the past day, which saw corporate earnings for industries related to AI perform well but the broader corporate landscape perform more erratically, has not significantly improved the underlying demand outlook for oil, keeping the growth-related sentiment cautious. Higher rhetoric around economic growth, which points to inflation declining and economic conditions stabilizing, would normally be expected to boost the underlying demand outlook for oil, but trade policy uncertainty and the current debates over tariff authority have negative growth implications for oil prices. The current unemployment claims data for the US also provides a short-term catalyst for oil prices, where higher-than-expected readings could negatively impact oil due to slower economic growth, while lower-than-expected readings could boost oil due to improved underlying demand outlooks, even if a higher dollar caps the upside. The European Central Bank also plays a role in oil pricing due to its impact on the global interest rate environment, which in turn impacts the value of the dollar against other currencies, where a higher dollar would negatively impact oil prices due to its impact on the global oil price given its status as a global reserve currency. The current oil pricing environment is a balance of the impact of sanctions risk, tariff uncertainty, the underlying oil supply surplus projections from OPEC and the IEA, and the impact of economic data releases. As such, until sanctions risk and tariff uncertainty are no longer prominent issues in the oil market, the current price environment will continue to be volatile but range-bound.
Bitcoin Prices: How Do Geopolitical Policy Signals, Labor Data Surprises, and Institutional Flows Impact the Direction of Bitcoin Prices Today?
Bitcoin is currently changing hands at around $68,778, with a gain of around +1.15% on the session thus far as of Thursday, 26 February 2026. This comes after a significant correction in the past few weeks following a run-up to levels north of $100,000 just last year. Recent price action has been marked by considerable volatility, with substantial increases in traded volumes accompanying the selloff in February before stabilizing in the upper $60,000s. Market commentary this past week pointed to resistance levels in the mid-$60,000s while also pointing to potential risks for a decline in prices in the near term. Derivatives markets in Chicago have been increasingly impacting spot prices. Outflows of institutional capital and extreme fear levels have also been impacting prices in the mid-week session thus far. However, announcements of new U.S.-centric institutional Bitcoin ventures have highlighted that developments in this space remain robust despite the current price action. Regulator trackers pointing to the changing policy environment in the U.S. with regards to cryptocurrencies and a more stringent environment in Asia have also been impacting prices. This is a clear indication that Bitcoin is changing hands at the confluence of macro conditions, policy developments, and institutional risk management.
While the political messaging of economic strength, declining inflation, lower mortgage interest rates, and a narrative of national turnaround likely supports higher risk appetite, which in turn could temper immediate investment in alternative assets, the renewed discussion of tariff authority, sanctions expansion, geopolitical tensions related to Iran, and trade policy recalibration likely maintain the uncertainty premium in global asset classes. As a non-sovereign asset, Bitcoin appears to be influenced more by the overall policy environment uncertainty than specific economic data points or policy announcements. Yesterday’s economic tone of continued earnings strength in AI-related equities but narrow breadth and increasing volatility likely maintained the environment of selective risk-taking, which has been supportive of Bitcoin but not at a rate sufficient to drive significant speculative flows into the asset class. The US unemployment claims data announced today is likely to be a significant short-term driver of Bitcoin price action, as a weaker-than-expected report could weaken the US dollar, drive real interest rate decline, and increase flows into Bitcoin, while a stronger-than-expected report could reinforce a strengthening US dollar, which would likely weigh on Bitcoin. In the current environment, Bitcoin price action appears to be influenced by a combination of macroeconomic data surprises, geopolitical policy announcements, derivatives market activity, and institutional investor sentiment, rather than retail momentum cycles.
ETH Prices: What Impact Do ETF Flows, Whale Accumulation, and Macro Liquidity Trends Have on the Price of Ethereum Today?
The price of Ethereum is currently trading at $2,076. The price has increased by +0.93% on the day so far as of 26th February 2026. The price action is showing the long-term correction that has been ongoing since the price action fell from the $4,500 zone towards the end of last year. The price action in the month of February saw the price action drop towards the $1,700 to $1,800 zone before stabilizing at the $2,000 zone. The volume action during the price drop has increased significantly in the most recent price drop. The price action is showing signs of stabilizing after the drop. The price action over the course of the last week has shown continued outflows from the Ethereum ETFs listed in the US markets. However, the whale addresses have continued to accumulate the Ethereum coins during the price drop. The whale addresses are the large wallet addresses that are used to buy the ETH coins during the price drop. The whale addresses have continued to accumulate the coins during the price drop. The derivatives data is showing that the negative funding rates are present in the markets.
This tenuous equilibrium is further supported by macroeconomic conditions and policy developments. Overall macroeconomic conditions with a political narrative around economic strength and falling inflation rates tend to reduce the need for defensive allocations in crypto assets; however, ongoing debates around the extension of new U.S. trade tariff authorities, geopolitical sanctions, and trade tensions support a macro risk premium that can have a positive indirect impact on crypto asset diversification. Yesterday’s economic conditions provided a mixed macro environment with robust earnings in AI-related stocks but a relatively narrow leadership with high volatility; this environment did not encourage aggressive speculation in Ethereum, keeping the price action relatively range-bound rather than trend-enhancing. Today’s U.S. unemployment claims will be a macro catalyst for Ethereum prices; a weaker unemployment rate than expected will have a positive impact on the U.S. dollar and liquidity conditions, providing support to ETH prices, whereas a stronger unemployment rate will have a positive impact on the dollar, constraining ETH prices. Ethereum’s price action is currently driven by a combination of factors including ETF flow directions, whale balance accumulation patterns, derivatives markets, and macro conditions; however, a sustained move in ETH prices is likely to be driven by a stabilization in institutional ETF flow directions.
