Where are Markets Today?
U.S. and European equity futures are positioned to open lower on Monday, 23 February 2026, as investors react to the announcement that global tariffs will rise to 15 percent from 10 percent following the Supreme Court’s decision to strike down the earlier reciprocal tariff framework. Dow futures are down roughly 0.6 percent, while S&P 500 and Nasdaq futures are lower by about 0.7 percent and nearly 1 percent respectively. European futures, including contracts tied to the DAX and EURO STOXX 50, are also trading in negative territory, signaling a synchronized risk-off tone across transatlantic markets. The primary driver of this weakness is renewed trade policy uncertainty, which complicates corporate cost projections and clouds the outlook for global growth and inflation dynamics.
Markets are opening lower for two core reasons. First, the immediate increase in tariffs and signals of further levies over the coming months introduce unpredictability into supply chains, pricing power, and earnings visibility. Investors had initially interpreted the court ruling as a potential easing of trade tensions, but the rapid policy reversal has heightened volatility and forced repricing of growth expectations. Second, the macro backdrop remains fragile: slowing personal income growth, a declining savings rate, and persistent core inflation near 3 percent reinforce concerns about tightening liquidity and constrained consumer demand. These factors collectively dampen risk appetite and amplify sensitivity to policy shocks.
Commodity and digital asset markets reflect this defensive positioning. Brent crude has slipped toward the low $70s per barrel, while U.S. crude trades in the mid-$60s, as traders weigh tariff-driven demand risks against geopolitical supply uncertainty. Bitcoin has fallen below $65,000, extending its recent correction amid broad-based de-risking and elevated real yields. The pullback across asset classes underscores how tariff escalation and geopolitical rhetoric can trigger cross-market volatility, particularly when liquidity conditions are already tight and growth signals are mixed.
Looking ahead, durable goods and factory orders data due today will be closely watched for confirmation of industrial momentum or further slowdown. Central bank commentary and geopolitical developments remain critical swing factors for risk assets. Until there is clearer guidance on trade implementation, inflation trajectory, and diplomatic progress, futures are likely to remain sensitive to headline risk and policy recalibration. Markets are pricing not only the direct economic impact of higher tariffs but also the uncertainty premium attached to their execution and duration.
Major Index Performance as of Monday, 23 Feb 2026
- S&P 500: Trading at 6,909.51, modestly softer as mega-cap leadership narrows.
- Nasdaq Composite: Trading at 22,886.07, pressured by volatility in growth and AI-linked infrastructure names.
- Dow Jones Industrial Average: Trading at 49,625.97, showing relative resilience supported by defensive components.
- Russell 2000: Trading at 2,663.78, stabilizing but lacking strong upward conviction.
The Magnificent Seven and the S&P 500
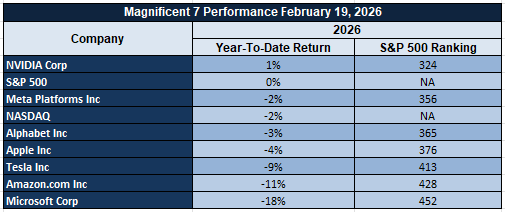
The Magnificent Seven — Apple, Microsoft, Nvidia, Amazon, Meta, Alphabet, and Tesla — remain central to index direction. While AI infrastructure spending continues to support long-term narratives, short-term valuation compression and financing sensitivity are weighing on sentiment. Concentrated leadership remains a defining feature of the S&P 500, and sustained upside will require either renewed mega-cap momentum or broader sector participation.
Drivers Behind the Market Move – Monday, February 23, 2026
As U.S. and European markets begin the week, investor sentiment is being shaped by renewed trade escalation, heightened geopolitical rhetoric, and sensitivity to incoming economic data. Developments over the weekend have shifted focus back to policy uncertainty rather than judicial clarity, while central bank communication risk and industrial data releases add another layer of volatility. These overlapping factors are driving weakness in futures and reinforcing a cautious cross-asset tone.
- Global Tariff Increase and Trade Policy Recalibration
The announcement that global tariffs will rise to 15 percent from 10 percent under Section 122 has reintroduced trade uncertainty into global markets. The move follows the Supreme Court’s decision to strike down the previous broad tariff framework, but instead of easing tensions, it has intensified policy unpredictability. Markets are now pricing in potential margin compression, higher input costs, and slower global trade flows. European exporters are particularly sensitive to higher U.S. tariff barriers, while U.S. multinationals face earnings visibility challenges. The signaling of additional legal pathways for future tariff action has extended the risk horizon, contributing to synchronized downside pressure in both U.S. and European futures.
- Geopolitical Posture and Energy Sensitivity
Rhetoric surrounding a possible limited military strike on Iran, alongside reports of expected talks in Geneva and a defined 10-day clarity window, has elevated geopolitical risk premiums. Trade actions being framed within a national security context further blur the line between economic and security policy. Energy markets are reacting to the dual forces of demand uncertainty from tariffs and supply disruption risk from Middle East tensions. This interplay is influencing equity positioning across industrial, defense, and energy-sensitive sectors, particularly in Europe, where energy security concerns remain structurally significant.
- Economic Data and Central Bank Communication Risk
Recent economic data showing slower income growth, a declining savings rate, and persistent core inflation near 3 percent underscore tightening financial conditions. Today’s durable goods and factory orders data will be closely watched for confirmation of industrial resilience or emerging slowdown signals. In parallel, speeches from Federal Reserve Governor Waller and ECB President Lagarde introduce rate-path uncertainty. Any hawkish reinforcement of restrictive policy could sustain pressure on equities, while dovish recalibration may offer temporary stabilization. The combination of tariff escalation, geopolitical tension, and policy communication risk is reinforcing a defensive bias across markets.
In summary, renewed trade escalation, geopolitical volatility, and macro-policy sensitivity are the dominant drivers shaping U.S. and European market moves today. Investors are recalibrating risk exposure as they navigate elevated uncertainty across both economic and political fronts.
Digesting Economic Data:
The TRUMP Tweets and Their Implications
The February 20–22 period was dominated by a sharp recalibration of trade policy following the Supreme Court’s decision to strike down the administration’s broad tariff framework. In response, the President signed a proclamation imposing a temporary import surcharge and announced a new 10 percent global tariff under Section 122, later signaling that the rate could rise to 15 percent — described as the maximum under that authority. The White House framed these actions as necessary to address international payments imbalances and defend domestic industry, while also indicating additional legal paths for future tariff measures. This sequence of events introduces renewed uncertainty into global trade flows, corporate supply chains, and pricing structures, increasing volatility across equity, currency, and commodity markets as participants reassess cost pass-through dynamics and growth expectations.
Beyond trade, the rhetoric extended into national security territory. The President linked tariff authority to national security, hardened his posture on Iran, and signaled a potential limited military strike while also referencing a 10-day window for clarity on negotiations. Reports of expected U.S.–Iran talks in Geneva add a diplomatic counterweight, but the coexistence of escalation language and negotiation signals creates a fluctuating geopolitical risk premium. Energy markets, safe-haven assets, and defense-linked equities are particularly sensitive to this dual-track messaging, as supply disruption risk and security uncertainty influence capital allocation decisions.
Domestic positioning was also reinforced through messaging around industrial expansion, including a meeting with the Novartis CEO citing plans for 11 U.S. plants, visits to steel facilities, and promotion of energy dominance initiatives such as the Indo-Pacific Energy Security Forum. The administration defended GDP performance despite shutdown effects and attributed growth slowdown to political opposition, while continuing suspension of duty-free de minimis treatment signals a stricter import environment. These elements collectively underscore an economic narrative centered on reshoring, industrial investment, and stricter trade enforcement — themes that may support select manufacturing and energy segments while increasing input costs for globally exposed firms.
Finally, broader political communication — including State of the Union promotion, law-and-order messaging, digital outreach content, and high-visibility public appearances — reinforces a strategy of sustained media presence during what the White House described as an active trade and security period. Market implications remain concentrated around three channels: tariff escalation risk, geopolitical uncertainty, and industrial policy signaling. Together, these factors heighten cross-asset volatility, compress corporate visibility on future margins, and sustain a defensive bias in global investor positioning until clearer policy direction or diplomatic stabilization emerges.
Executive Order Imposes Blanket Tariff, Extends Trade Policy Uncertainty
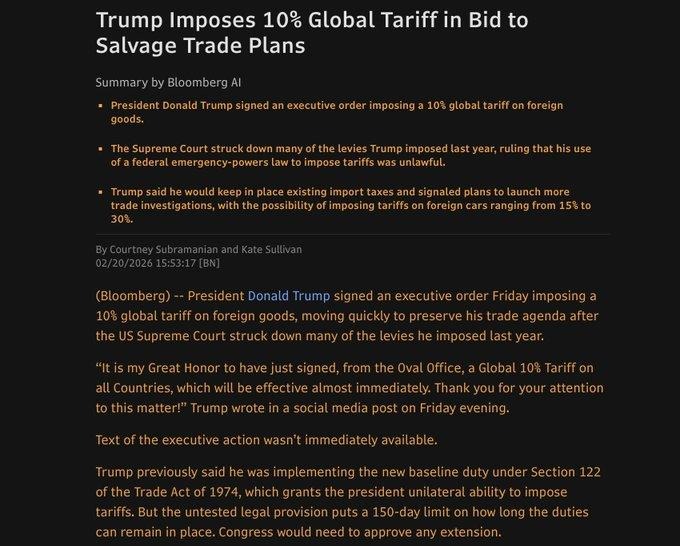
We are currently evaluating the macroeconomic implications of the executive order, which establishes a blanket tariff of 10% on all imports from foreign nations in accordance with Section 122 of the Trade Act of 1974. This is a temporary action, replacing previously invalid emergency-based trade tariffs. It has maintained existing trade policies under Section 301 and Section 232. Although this action provides a degree of policy stability in the short term, there is a strict 150-day duration of this policy unless extended by Congressional approval. There is a layered risk structure in this policy, with direct costs from the tariff and indirect costs from the timeline uncertainty of Congressional negotiations. There is a market response to the direct costs of the tariff, in addition to the response to the risk of further trade tensions, including a potential tariff on foreign automobiles.
Economic transmission of broad tariffs can be viewed as a tax levied on consumption and production inputs. Trade history has shown that levies placed on imports tend to increase consumer prices, tighten profit margins for firms reliant on international trade, and reduce overall purchasing power. Historically, employment effects have been minimal compared to costs levied on consumers and firms. As such, broad tariffs could act to reduce long-run growth by undermining incentives for international trade and promoting capital wastefulness. Investors should be prepared for a pick-up in inflation volatility for goods, dispersion in margins by industry, and responsiveness in discretionary expenditures.
In this environment, Whirlpool Corporation (WHR) appears undervalued relative to its North American manufacturing base and pricing leverage. As imports of appliances face cost pressures, homegrown manufacturers could benefit from pricing and shelf leverage. Of course, this is contingent upon consumer resilience and ability to contain input costs. Analysts should be focused on retail sales trends, shifts in imports, inventory cycles, and congressional passage probabilities with 150 days remaining before a deadline. Domestic manufacturers with production depth, pricing leverage, and balance sheet discipline should be viewed favorably in a tariff environment.
December New Home Sales Decline as Financing Costs Constrain Activity
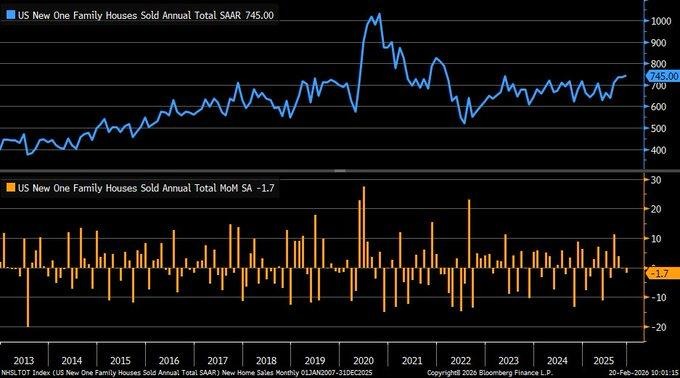
In evaluating new home sales for December 2025, we observed a 1.7% decline month-over-month, resulting in a seasonally adjusted rate of 745,000 units. This figure fell short of expectations as sales were expected to stabilize. This represents a continuation of the normalization trend that began after the 2021 surge in sales, where sales were above a rate of one million units. The dominant factor affecting sales has been mortgage rates that have remained above 6.5%, which directly affects affordability ratios and monthly payment burdens. This represents a cyclical rather than a structural demand restraint. If adjusted for demographic growth and household formations, sales levels are currently within historical cycle highs.
In terms of inventory levels, available supply currently sits at 472,000 units and has fallen 3.5% year-over-year. This represents a tight supply and cautious buyers rather than an oversupply situation. Homebuilders are now relying on incentives and rate buydowns to sustain sales contracts. This represents a tight supply and cautious buyers. The macro-level channel through which the housing cycle affects the broader economy includes construction employment, building materials demand, household durable goods, and regional credit. As such, the housing cycle represents a leading indicator for macro-level consumer balance sheet and overall economic growth.
In this context, Lennar Corporation (LEN) represents an undervalued company based on its scale efficiency, land-light business model, and capital allocation. Its diversified geographic footprint and ability to manage its speed allow it to maintain margins in a slower sales rate while still benefiting from a rate reduction. Analysts should focus on the direction of mortgage rates, cancellation rates, order backlog quality, builder gross margin performance, and building permits issued as a way to evaluate the initiation of a housing recovery phase. Companies that have strong liquidity positions, disciplined land models, and flexibility are structurally positioned to benefit from a rate-sensitive housing cycle.
Q4 Consumption Growth Moderates as Spending Normalizes
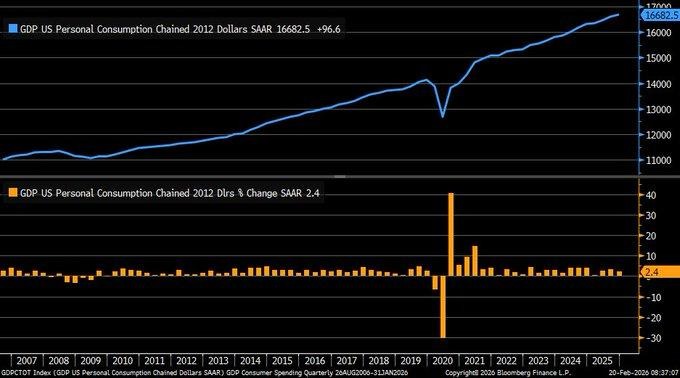
In the current context, the assessment of fourth-quarter 2025 personal consumption expenditures growth is at 2.4% annualized, quarter-over-quarter, which is in line with expectations. It is, however, lower than the 3.5% growth rate reported during the last quarter. It is important to note that consumption expenditures constitute about 70% of the total economic output, making this moderation a vital indicator for the future growth trajectory. The moderation is not necessarily a contraction, given the high level of demand for goods that is normalizing into the services-oriented spending patterns. This is a clear indicator that consumers are active, albeit becoming more selective, focusing on experiences rather than durable goods. Overall, this is a transition from acceleration to stability in consumption-driven growth.
In the context of the macro transmission mechanism, the moderation of consumption growth is likely to reduce upward price pressures while maintaining the baseline level of economic resilience. This is because the moderation is likely to reduce the pricing pressures emanating from the goods sector while maintaining the resilience of the services sector, especially the travel, healthcare, and leisure sectors. Overall, this is a positive indicator for the economy, given that the moderation is likely to reduce the likelihood of inflationary pressures while maintaining the income flow to the service sector. Overall, this is a positive indicator for the economy, given that the moderation is likely to reduce the likelihood of inflationary pressures while maintaining the income flow to the service sector.
In the context of the current situation, Starbucks Corporation, trading under the ticker symbol SBUX, is viewed as undervalued, given the service-oriented revenue model that is likely to be boosted by the normalization of consumption expenditures into the experience-oriented spending patterns. Overall, the company’s business leverage, especially given the high foot traffic locations, is likely to be more durable despite the moderation of the demand for goods. Overall, this is a positive indicator for the economy, given that the moderation is likely to reduce the likelihood of inflationary pressures while maintaining the income flow to the service sector.
Real Final Sales Growth Signals Underlying Domestic Expansion
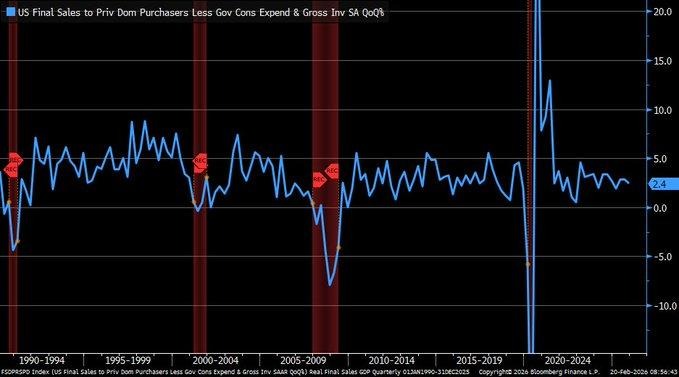
We are analyzing the Q4 2025 real final sales to private domestic purchasers, where the figure is up by 2.4% on a quarterly annualized basis. This figure excludes inventory, government spending, and exports, providing a more accurate picture of the underlying growth. Although this figure is lower than the previous period, it is still significantly higher than the historical figures that signal recessionary conditions. The data indicates that the underlying core domestic demand is still growing, even though some of the broader GDP figures are more volatile. What is more important is that this figure is a more accurate representation of the underlying revenue growth potential for the more domestically focused sectors of the economy.
In the context of the broader economy, the data indicates that the underlying household and business demand is still growing, albeit at a slower rate. The inflation rate on these sales is still relatively high at 3.7%, indicating that the price impact is still supporting the nominal figures. However, the high level of debt that households are carrying, coupled with the impact of rising interest rates, may eventually impact the level of affordability. The interplay between income growth and debt repayment capacity will be the determining factors that influence the sustainability of the current level of demand. For the markets, the data indicates that the level of recessionary risk is low, although the impact on margins for companies that are more exposed to discretionary spending patterns is a concern.
Within this context, the Lowe’s Companies, Inc. (LOW) is viewed as undervalued given the level of domestic revenue concentration and the level of maintenance-driven housing expenditure. Even during the moderating phase of the cycle, repair and improvement expenditure is viewed as more durable compared to more discretionary patterns of expenditure. The company’s approach to capital allocation is viewed as providing resilience even during debt-sensitive consumer patterns. Analysts should be monitoring the level of real wage growth, household debt servicing, consumer credit delinquency rates, and the sustainability of price inflation for the broader retail sector.
December Income Growth Moderates, Spending Growth Exceeds Income Growth
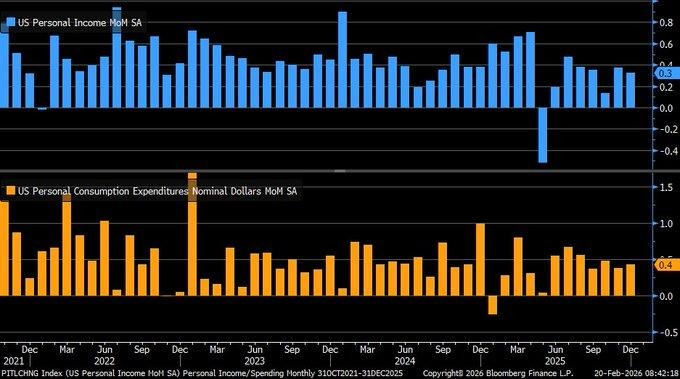
In this report, we analyze personal income growth in December 2025, where income growth moderates to +0.3% month-over-month from a revised +0.4% in November. Consumer spending growth, meanwhile, is flat at +0.4% after being revised. This shows that personal income growth is lagging consumer spending growth. Real disposable personal income per capita decreased slightly following the inflation adjustment. This shows that people’s purchasing power is gradually shrinking, not expanding. Although this change is small, any disparity in earnings and outlays can be a significant factor in future consumption. This is a clear example of a consumer market that is still active but is gradually relying on personal savings to make ends meet. As a result, personal savings rates decreased to 3.6% from 3.7%.
However, with core PCE inflation now increasing to 3.0% year-over-year, any future monetary policy easing is complicated. As a result, monetary policy is still restricted. As income growth moderates, real demand growth is likely to slow in future quarters, given that inflation is still high. Although there is little evidence of a recession, there is some evidence of increasing affordability pressures beneath the surface of stable consumer spending.
In this environment, Walmart Inc. (WMT) appears to be undervalued, given its defensive nature and its customer base. During any given period where real income growth slows and personal savings rates decrease, people tend to shop at stores where they can save money. As a result, Walmart is well positioned to benefit from any future shifts in consumer spending. As a result, analysts should focus on personal savings rates, real income growth, consumer credit, and core inflation to gauge future sustainability of consumer spending.
Weekly Retail Sales Post Sharpest Fall Since Early Autumn
We are analyzing a 0.5% weekly decline in retail sales for the last week of January 2026, which registers the largest fall since September 2025. Seasonally adjusted retail sales show a change in direction from consistent month-on-month growth to a noticeable slowdown in consumer spending. This change in direction is important as retail spending is a high-frequency indicator of household confidence and liquidity. This week’s fall follows a few weeks of slowing retail sales, indicating that the momentum in consumption spending is no longer widespread. While labor market trends remain steady, the current pattern reflects a growing disconnect between income stability and spending power.
This week’s fall in retail sales is consistent with other indicators in the economy, such as a slowdown in housing spending and high core inflation of 3.0%. All these trends indicate a growing squeeze on the budgets of households. In the retail space, a slowdown in spending tends to begin in the discretionary segment of the market before spreading to the entire market. In the current situation, high inflation and slowing savings accumulation leave households less room for absorbing price inflation. The macroeconomic transmission mechanism for the retail space involves margin pressure for non-essential retailers, the possibility of inventory build, and revisions in retailer earnings if the current sales volatility continues. While the current retail sales trends are not recessionary in nature, the current trends in the retail space add to the growing consensus of a highly cautious consumer.
In the above context, Costco Wholesale Corp. (COST) appears undervalued given its membership-based business model. In an environment where households are under pressure, consumers tend to look for value in the products they buy. In the current situation, households tend to look for value in the products they buy, which makes Costco an attractive bet. Analysts should look for trends in weekly retail sales consistency, inventory to sales ratio, consumer credit balances, and wage growth trends to gauge whether the current trends in the retail space translate into a sustained slowdown in retail spending.
The sharp fall in goods imports simply reflects an inventory reset, not demand shock.
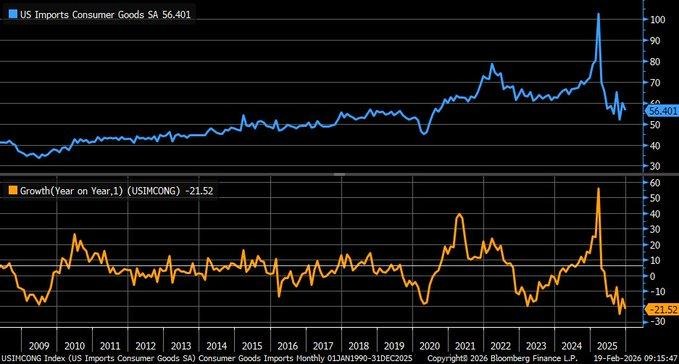
We are examining a -21.5% year-over-year fall in seasonally adjusted consumer goods imports in December 2025, the largest decline since the financial crisis period. This sharp fall in the import index from its 2022 peak of 100 to 56 indicates a significant change in trade flows. However, the cause of the fall seems to be inventory normalization, as opposed to demand shock, given the sharp fall in the import index due to the unwinding of pre-payments made in 2024 due to higher tariff rates in 2025. Average tariff rates have risen from 2.6% to 13%. Pharmaceuticals make up a large portion of the $3.5 billion fall in goods imports in December 2025.
In a macroeconomic sense, the inventory liquidation contributes to a trade balance adjustment in the short term but adds a future inflationary risk. Once the stock runs out, replenishment of the same products could result in a 20%+ cost increase for the products due to the tariff-inclusive price. This creates a delayed cost pass-through effect, where the current import contraction may not reflect the future inflationary implications. In the past, the trade deficit in goods recorded a record high of $1.24 trillion, which reflects the reliance of the economy on the import of various products.
If the inventory replenishment happens under a high tariff regime, the margin pressure and the reacceleration of inflation may become an issue in the future, especially for products that depend heavily on the global supply chain. In the current scenario, Procter & Gamble Co. (PG) appears to be undervalued based on its price-setting and diversification capabilities. In the future, as the cost pressure due to tariffs reappears in the inventory replenishment period, the company’s scale advantage and price elasticity may prove to be a positive factor for the company.
Philly Fed Adjusted Index Indicates Stabilization Phase in the Industrial Sector
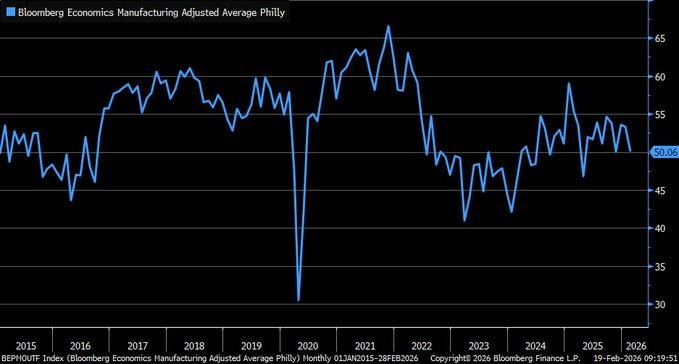
We are currently evaluating the February 2026 adjusted Philadelphia Fed Manufacturing Index, which has been adjusted to conform to broader Purchasing Manager methodologies, resulting in a print of 50.06. The adjusted index is currently hovering around the 50-level, which indicates a neutral trend, as the industrial sector is neither growing nor declining. The stabilization trend in the adjusted index since late 2025 indicates an industrial sector that has moved beyond the severe contraction phase but has yet to witness an uptick in demand growth. The raw index has shown an improvement to 16.3, rising from negative levels, but the adjusted index indicates an industrial sector in equilibrium.
From a macroeconomic point of view, when the industrial sector is neutral, it indicates a normalization trend in inventory levels and capital spending. Supply chain issues continue to plague the sector, and order flow is moderating, which is restraining growth. The stabilization of the industrial sector is a positive indicator of low recession probability in the short term, but it also indicates a limit to growth potential. The industrial sector is focused on cost savings, lean inventory, and selective hiring, and the lack of contraction is indicative of steady earnings visibility for diversified industrial companies. However, margin growth will depend on price management and cost savings rather than volume growth.
In the context of the above, we believe that Eaton Corporation plc (ETN) is undervalued, given its exposure to the electrical infrastructure, energy transition, and industrial automation sectors. In a neutral industrial sector, companies that are more aligned to structural growth themes, rather than cyclical industrial production, are more likely to exhibit higher growth trends. The diversified revenue streams and order visibility will help insulate ETN from flat headline production growth. It is recommended that analysts track order growth, capital goods shipments, supplier delivery performance, and industrial credit trends to determine if the sector is shifting into an expansion or contraction phase. Companies that are more aligned to infrastructure and electrification themes are strategically well-positioned, even when the broader industrial sector is flat.
Upcoming Economic Events
FOMC Member Waller Speaks, ECB President Lagarde Speaks
As we head into the next trading session, the economic events calendar changes from data releases to central bank communications risks. We are entering a period of time where forward indicators are more important than backward indicators. We are in a period of time where interest rates are high, inflation is rising, and inflationary pressures are uncertain. Therefore, investors are looking at the communications of Federal Reserve Governor Waller and ECB President Lagarde to get a better understanding of the balance of risks, the level of confidence, and any triggers that may indicate changes in interest rates, financial conditions, and global capital flows.
FOMC Member Waller Speaks
Investors are looking at Governor Waller’s communications from the perspective of inflation persistence and growth resilience.
- Therefore, any hawkish signals from Governor Waller’s communications may result in higher bond yields, a higher dollar, and further weakness in real estate and growth technology equities that are interest-rate sensitive. A higher-than-expected hawkish message from Governor Waller’s communications would support the notion that interest rates are going to be higher for longer, further tightening financial conditions.
- Conversely, any dovish signals from Governor Waller’s communications may result in higher risk assets, lower bond yields, and further cyclical equities benefiting from the improved financial conditions. Therefore, analysts are looking at changes in interest rate futures, yield curves, and equities to get a better understanding of the direction of interest rates.
ECB President Lagarde Speaks
Lagarde’s speech can have implications for global risk and currency markets.
- A firmer tone than expected by investors could have positive implications for the Euro and negative implications for equities that are vulnerable to interest rate risks. A higher level of hawkish rhetoric than expected could have positive implications for global bond markets. A decline in yields could be seen globally.
- If Lagarde’s speech has a softer tone and reflects concerns about growth, fragmentation risks, and a willingness to ease monetary policy, yields could decline in Europe and equities could find relief support. Currency markets are likely to respond quickly to any signs of a divergence between the ECB and Federal Reserve’s policy paths. Multinationals such as Microsoft Corporation (MSFT) could be a good bet for valuation opportunities as currency volatility could have a greater impact on their earnings.
Stock Market Performance
Indexes Recover from April Lows, But Internal Drawdowns Tell the Real Story
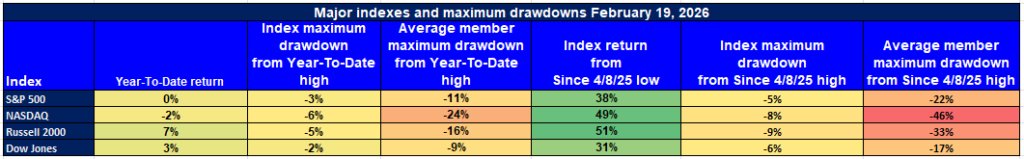
Although the performance of the stock market indexes looks good, the internal stock market performance, as indicated by the drawdown data, suggests that the market is more complex than the performance of the stock market indexes. The performance of the stock market indexes this year is mixed, while the rebound from the low on April 8, 2025, is robust. However, the performance of the average members of the stock market indexes is still lower than the performance of the stock market indexes. This is a clear indication that the stock market leadership is still narrow, while the volatility of the stock market is not yet out of the woods.
Here is the stock market performance based on the data from the charts:
S&P 500: Flat Year, Strong Rebound, Narrow Leadership
YTD: 0% | +38% since 4/8/25 low | -3% from YTD high | Avg. member: -11%
The performance of the S&P 500 this year is flat, while the rebound from the low on April 8, 2025, is robust. Although the stock market index experienced a limited -3% drawdown from the high this year, the performance of the average members of the stock market index is lower, at -11% from the high this year. However, the performance of the stock market index since the low on April 8, 2025, is robust at +38%, while the performance of the average members of the stock market index is lower, at -22% from the high during the same period.
NASDAQ: Powerful Rebound, Deep Internal Stress
YTD: -2% | +49% since 4/8/25 low | -6% from YTD high | Avg. member: -24%
The NASDAQ remains down -2% YTD but has staged the strongest recovery of +49% from its low on April 8th. Although its drawdown from its YTD high remains moderate at -6%, its constituents have declined -24% from their YTD highs. Most notably, its constituents have declined -46% in maximum drawdown since its low on April 8th, even in its strongest recovery. This shows ongoing volatility in technology and growth stocks, where only a handful of large-cap names are driving performance.
Russell 2000: Strong Headline Gains, Uneven Participation
YTD: +7% | +51% since 4/8/25 low | -5% from YTD high | Avg. member: -16%
The Russell 2000 is currently up +7% YTD and +51% from its low on April 8th. At its level, its drawdown from its YTD high remains limited at -5%. Nevertheless, its constituents have declined -16% from their YTD highs and have fallen -33% in maximum drawdown since April 8th. This shows that although small-cap indexes are currently looking healthy in terms of performance, their constituents are still volatile.
Dow Jones: Relative Stability, But Not Immune
YTD: +3% | +31% since 4/8/25 low | -2% from YTD high | Avg. member: -9%
The Dow Jones is currently up +3% YTD and +31% from its low on April 8th. At its level, its drawdown from its YTD high remains limited at -2%, making it the most stable of all major indexes. Nevertheless, its constituents have declined -9% from their YTD highs and have fallen -17% in maximum drawdown since April 8th. Even though the Dow Jones is more stable than other major indexes, its constituents are still declining.
We at Zaye Capital Markets understand that while index resiliency does not automatically equate to market resiliency, rallies will only sustain themselves if breadth improves, dispersion in drawdowns diminishes, and average member participation increases. Until then, selectivity remains a necessity.
The Strongest Sector In All These Indices
Energy Leads Year-to-Date and Month-to-Date, Clear Market Leadership
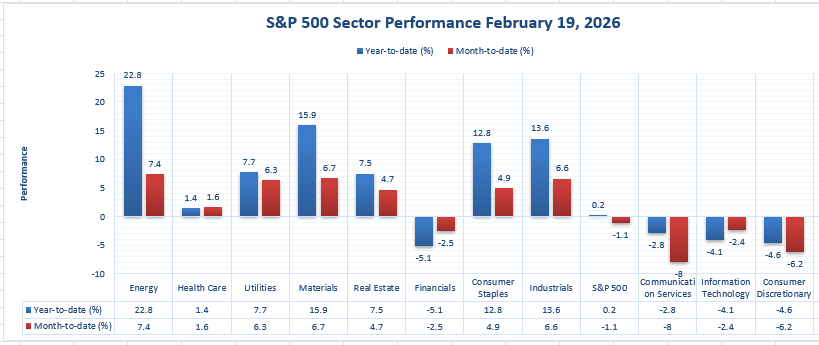
Our interpretation of this sector scoreboard is simple: Energy is currently the strongest sector in each of these indices, and by a wide margin. It is currently up 22.8% year-to-date, and also has the best month-to-date return, up 7.4%. It is important to note that a sector is strong in a given timeframe, and then still be strong in a subsequent timeframe. This is why Energy’s leadership in these indices is so compelling, since it is not just a function of past success, but still a work in progress in the current timeframe.
It is worth noting that when you look at Energy compared to the next strongest sectors, there is still a significant difference. Materials is up 15.9% year-to-date and 6.7% month-to-date, Industrials is up 13.6% year-to-date and 6.6% month-to-date, Utilities is up 7.7% year-to-date and 6.3% month-to-date, Real Estate is up 7.5% year-to-date and 4.7% month-to-date, and Consumer Staples is up 12.8% year-to-date and 4.9% month-to-date. There are a number of sectors that are still negative in this timeframe, including Financials, -5.1% year-to-date, Communication Services -2.8% year-to-date, Information Technology -4.1% year-to-date, and Consumer Discretionary -4.6% year-to-date.
It is worth taking a look at the overall index in this chart, since that will provide some background on why a strong sector is important. As you can see, the S&P 500 is only up 0.2% year-to-date, and is actually -1.1% month-to-date. That means that in this environment, a sector that is up 22.8% year-to-date and 7.4% month-to-date, like Energy, is by far the strongest sector in all of these indices.
Earnings
Earnings — February 20, 2026
- PPL Corporation reported full-year 2025 GAAP earnings of $1.18 billion, or $1.59 per share, on revenues of $9.04 billion. In Q4 2025, GAAP earnings were $266 million, or $0.36 per share, with revenues of $2.27 billion. Earnings from ongoing operations totaled $305 million, or $0.41 per share. The company guided 2026 ongoing EPS to a range of $1.90–$1.98, reinforcing visibility around regulated earnings growth and infrastructure investment execution.
- Lamar Advertising Company Class A reported full-year 2025 net revenues of $2.27 billion and net income of $593.1 million, or $5.77 per diluted share, with adjusted EBITDA of $1.06 billion. In Q4 2025, net revenues were $595.9 million, net income was $154.7 million, or $1.50 per diluted share, and adjusted EBITDA reached $288.9 million. The company guided 2026 AFFO to $8.50–$8.70 per share, highlighting continued cash flow durability.
- AngloGold Ashanti PLC delivered full-year 2025 headline earnings of $2.725 billion, with gold production of 3.1 million ounces, free cash flow of $2.9 billion, and adjusted EBITDA of $6.3 billion. Total dividends declared amounted to $1.8 billion. In Q4 2025, revenue was $3.068 billion, GAAP earnings were $855 million, or $1.68 per share, and adjusted earnings were $967 million, or $1.90 per share. The average gold price received was $3,468 per ounce.
- Danone SA reported full-year 2025 sales of €27,283 million, up 4.5% like-for-like. Recurring operating income was €3,665 million with a margin of 13.4%, up 44 basis points. Recurring diluted EPS was €3.80, up 4.6%, while net income (Group share) totaled €1,825 million. Free cash flow reached €2.8 billion, and the proposed dividend increased to €2.25 per share. Q4 sales rose 4.7% like-for-like, driven by volume/mix of 2.5% and price of 2.1%.
Earnings — February 23, 2026
- Domino’s Pizza, Inc. reports today, with investor focus on same-store sales momentum, franchise margin performance, commodity cost management, and digital order penetration as core indicators of operating leverage and demand resilience.
- Diamondback Energy, Inc. reports with emphasis on production volumes, capital expenditure discipline, and free cash flow allocation strategy, particularly in relation to shareholder returns and balance sheet positioning.
- ONEOK, Inc. will be evaluated on throughput volumes, fee-based revenue stability, and distribution coverage strength, which remain central to midstream cash flow sustainability.
- Hims & Hers Health, Inc. Class A reports with investor attention centered on subscriber growth, recurring revenue expansion, customer acquisition efficiency, and margin progression within its digital health platform.
Stock Market Overview – Monday, 23 Feb 2026
U.S. equity markets opened the week on cautious footing as investors balance AI infrastructure enthusiasm against financing constraints, trade uncertainty, and persistent inflation dynamics. Large-cap indices remain heavily influenced by mega-cap technology names, while the Dow Jones shows relatively steadier performance due to its defensive composition. The Russell 2000 is attempting to stabilize, but conviction remains limited as capital continues to favor balance sheet strength and scalable earnings models. At Zaye Capital Markets, we are closely monitoring breadth expansion before turning structurally constructive on index-level upside.
Stock Prices
Economic Indicators and Geopolitical Developments
Today’s market tone reflects a combination of trade policy uncertainty, elevated core inflation near 3.0%, and tight liquidity conditions. With monetary policy expectations recalibrating amid persistent price pressures, equity risk premiums remain compressed. Geopolitically, trade implementation mechanics and global supply alignment strategies continue to influence sector dispersion. Power availability and infrastructure scalability are increasingly viewed as structural economic constraints, particularly within AI-driven capital expenditure cycles.
Latest Stock News
- $GOOGL | Alphabet launched Pomelli “Photoshoot,” enabling AI-generated product visuals from a single image, further integrating creative production into its commerce and advertising stack. The company is also exploring spinning its TPU division into a standalone unit while investing approximately $100M in Fluidstack at an ~$8B valuation and backing projects tied to $CIFR, $HUT, and $WULF to expand TPU demand.
- $CRWV | CoreWeave declined roughly 12% after reports that $OWL was unable to secure financing for a $4B data center project. Capacity constraints may redirect AI workloads toward hyperscalers such as $AMZN, $MSFT, and $GOOGL Cloud.
- $PANW $FTNT $ZS $RBRK $CRWD | Cybersecurity names traded lower following the limited preview launch of AI-native code security tools capable of scanning vulnerabilities and suggesting targeted fixes, raising concerns about competitive pressure within traditional security stacks.
- $MSFT | Microsoft trades near decade-low valuation multiples despite Azure capacity constraints and Copilot integration across more than 450 million enterprise users, reinforcing its distribution advantage within enterprise AI monetization.
The Magnificent Seven and the S&P 500

The Magnificent Seven — Apple, Microsoft, Nvidia, Amazon, Meta, Alphabet, and Tesla — remain central to index direction. While AI infrastructure spending continues to support long-term narratives, short-term valuation compression and financing sensitivity are weighing on sentiment. Concentrated leadership remains a defining feature of the S&P 500, and sustained upside will require either renewed mega-cap momentum or broader sector participation.
Major Index Performance as of Monday, 23 Feb 2026
- S&P 500: Trading at 6,909.51, modestly softer as mega-cap leadership narrows.
- Nasdaq Composite: Trading at 22,886.07, pressured by volatility in growth and AI-linked infrastructure names.
- Dow Jones Industrial Average: Trading at 49,625.97, showing relative resilience supported by defensive components.
- Russell 2000: Trading at 2,663.78, stabilizing but lacking strong upward conviction.
At Zaye Capital Markets, we maintain that this remains a selective environment. Infrastructure funding discipline, earnings durability, and power scalability will determine leadership sustainability. Investors should prioritize quality balance sheets, visible cash flow generation, and sectoral positioning aligned with structural capital themes while monitoring breadth for confirmation of a durable recovery.
Gold Price: How Trade Policy Shifts and Central Bank Signals Drive Gold Prices
Spot gold is currently trading above $5,160 per ounce, holding near multi-week highs as markets reprice geopolitical risk and currency dynamics. The recent proclamation imposing a temporary import surcharge, the announcement of a new 10 percent global tariff under Section 122 with signals of a potential move toward 15 percent, and the Supreme Court ruling striking down the prior broad tariff framework have collectively increased policy uncertainty. Trade probes, legal recalibration of tariff authority, and rhetoric linking tariffs to national security elevate cross-border risk premiums. At the same time, comments referencing a possible limited military strike on Iran, a defined 10-day negotiation window, and active security developments reinforce safe-haven positioning. In this environment, gold benefits from a softer dollar and heightened hedging demand as investors seek protection against policy volatility, geopolitical escalation, and currency fluctuations. Upcoming speeches from FOMC Member Waller and ECB President Lagarde further intensify focus on real interest rate expectations, a critical driver of gold valuation through its inverse relationship with yields.
Yesterday’s economic data added another layer of support for bullion. Slowing personal income growth, a decline in the savings rate to 3.6 percent, flat consumer spending, and core PCE inflation at 3.0 percent underscore a consumer sector that remains active but increasingly constrained. These dynamics temper expectations for rapid monetary easing while sustaining concerns over purchasing power erosion. When growth moderates without a sharp inflation retreat, real yields often remain compressed, reinforcing gold’s relative appeal despite its non-yielding nature. The combination of tariff-linked trade friction, geopolitical tension, persistent inflation pressures, and central bank communication risk creates a macro backdrop where capital preservation strategies gain prominence. In this phase, gold functions simultaneously as a hedge against currency volatility, a buffer against geopolitical disruption, and a portfolio diversifier amid tightening liquidity conditions.
Oil Prices: How Trade Policy, OPEC Signals, and Central Bank Risk Move Oil Prices
Brent crude is currently trading near $71–72 per barrel, while WTI crude is hovering around $66–67 per barrel as of Monday, 23 February 2026, reflecting a market caught between geopolitical risk premiums and demand-side caution. Price volatility has intensified following recent White House announcements imposing a temporary import surcharge, signaling a 10 percent global tariff under Section 122 with a potential move toward 15 percent, and linking trade actions to national security authority. These developments increase uncertainty around global trade flows and economic momentum, which directly influence oil demand expectations. At the same time, rhetoric surrounding a possible limited military strike on Iran, a defined 10-day negotiation window, and ongoing Geneva talks injects a geopolitical premium into crude markets. Supply risks in the Middle East, particularly near strategic transit routes, continue to underpin prices even as traders evaluate the probability of escalation versus diplomatic resolution. Commentary circulating across macro-focused market channels highlights that any supply disruption narrative tends to lift Brent faster than WTI due to international exposure, reinforcing the global benchmark’s sensitivity to geopolitical tension.
Yesterday’s U.S. economic data added a second layer of complexity to oil sentiment. Slowing personal income growth, a decline in the savings rate, flat spending, and persistent core inflation near 3.0 percent suggest a consumer sector that remains active but increasingly constrained, raising concerns about forward fuel demand. When growth moderates while inflation remains sticky, demand elasticity becomes a central pricing variable in energy markets. Looking ahead, speeches from FOMC Member Waller and ECB President Lagarde will influence currency direction and real rate expectations, both of which are critical inputs for oil pricing through the dollar channel. A stronger dollar typically pressures crude by making it more expensive globally, while dovish central bank signals can support risk assets and commodity demand. In parallel, guidance from OPEC and demand projections from the IEA remain pivotal; any indication of production discipline or upward demand revisions would reinforce price support, whereas surplus projections could cap rallies. The oil ecosystem is therefore being shaped by a three-way interaction between trade policy uncertainty, geopolitical supply risk, and macroeconomic demand recalibration.
Bitcoin Prices: How Global Trade Escalation and Tight Liquidity Are Pressuring Bitcoin
Bitcoin is currently trading at $64,730, down approximately 4.26% on the session, according to the latest market snapshot. The broader structure reflects a persistent downtrend from late-2025 highs above $120,000, with successive lower highs and breakdowns confirming weakening momentum. The recent slide below the $70,000 level signals deteriorating risk appetite rather than isolated technical noise. Policy developments between February 20–22 have intensified macro volatility: the proclamation imposing a temporary import surcharge, the announcement of a new 10% global tariff under Section 122 with signals of a possible 15% ceiling, and rhetoric linking tariff authority to national security have elevated global uncertainty. The Supreme Court decision striking down the prior tariff framework initially sparked volatility, but follow-up trade escalation shifted markets into defensive positioning. In parallel, comments surrounding a potential limited military strike on Iran and a defined 10-day negotiation window have reinforced geopolitical tension. Bitcoin, increasingly correlated with high-beta equity exposure, reacted to this backdrop with selling pressure as global liquidity conditions tightened and cross-asset risk appetite weakened.
Yesterday’s economic data compounded that pressure. Slowing personal income growth, a decline in the savings rate to 3.6%, flat consumer spending, and core PCE inflation at 3.0% indicate a consumer sector facing tighter financial conditions without clear inflation relief. That environment sustains elevated real yields and constrains speculative capital allocation into non-yielding assets such as digital currencies. Reports describing Bitcoin’s worst start to a year through the first 50 days, persistent “panic premium” in options markets, and downside sentiment spikes reflect hedging behavior rather than aggressive accumulation. Structural developments such as expanded institutional trading infrastructure remain long-term supportive, but near-term price discovery is being driven by macro risk recalibration rather than crypto-native catalysts. If upcoming central bank commentary reinforces restrictive policy and dollar strength, downside volatility may persist; conversely, signals of easing liquidity could stabilize the $64,000–$65,000 region. The ecosystem is currently being shaped by trade policy escalation, geopolitical uncertainty, and tightening liquidity — not by supply-side Bitcoin fundamentals.
ETH Prices: How ETF Flows, Whale Moves, and Liquidity Risk Drive ETH Price
Ethereum is currently trading at $1,857.99, down roughly 5.05% on the session, according to the latest Coinbase daily snapshot (Feb 23, 2026, 04:52 UTC). Price action confirms a sustained downtrend from late-2025 highs above $4,500, with the breakdown below the key $2,000 psychological level marking a structural shift in momentum. The recent consolidation between $1,800 and $1,900 reflects stabilization attempts rather than confirmed reversal signals. Over the past week, spot ETH ETF flows have shown mixed behavior: earlier persistent outflows have slowed, but inflows have not been strong or consistent enough to generate upward price traction. Institutional demand therefore appears tentative rather than conviction-driven. In parallel, derivatives positioning shows elevated caution, suggesting that risk appetite remains subdued amid broader macro uncertainty. Without sustained ETF net creations, Ethereum lacks the structural bid required to challenge overhead resistance in the $2,000–$2,100 zone.
On-chain activity over the past several days indicates selective whale accumulation near recent lows, while some large holders have simultaneously transferred assets to exchanges during minor rebounds, creating distribution pressure. This dual dynamic increases short-term volatility as markets interpret exchange inflows as potential sell signals. Historically, sustained whale withdrawals into cold storage support medium-term recovery phases, whereas exchange deposits often precede downward extensions. The current ecosystem is being shaped not only by these wallet flows but also by tightening global liquidity conditions and elevated real yields, which raise the opportunity cost of holding non-yielding crypto assets. Until ETF flows turn decisively positive and whale exchange balances trend lower, Ethereum remains sensitive to macro risk sentiment and dollar strength. Structural fundamentals in decentralized finance and network usage remain intact, but near-term price discovery is dominated by institutional flow behavior and liquidity recalibration rather than ecosystem expansion narratives.
