Where Are Markets Today?
European and US futures markets are trading near flat as markets take a cautious stance. US markets are trading with mild weakness in Dow and S&P 500 futures, but Nasdaq futures are trading with mild gains. European markets are trading flat with minimal changes in all indices. The reason behind this flat trading is quite obvious, as markets are waiting to see what comes out of the interest rate decision. On the other hand, markets are also trying to digest the surge in oil prices, which is affecting inflation.
The first reason behind this flat trading is the surge in oil prices. Oil prices, as represented by Brent crude, are trading above $100 per barrel. The price of WTI crude is also trading close to this level due to fears of supply disruptions because of geopolitical risks. The surge in oil prices is not just affecting energy markets but is also affecting inflation. Oil prices are one of the leading drivers of inflation because they affect all industries as a cost of transport. The surge in oil prices is affecting all industries, and this is one reason why equity markets are trading flat. The reason is that equity markets are also vulnerable to this surge in oil prices because this surge in oil prices will cause interest rates to remain high, thereby affecting equity markets. European markets are more vulnerable to this surge in oil prices because they rely on imported energy.
The second major factor at play is the upcoming policy decision and economic data releases, which are acting as anchors for the market direction. While the market is likely to remain stable with interest rate decisions remaining unchanged, the key factor at play is the forward guidance on the impact of rising energy costs on inflation and economic growth. Additionally, the upcoming producer price data is also likely to indicate moderate increases, and any upside surprise could add to the inflation risks emanating from rising oil costs.
However, the underlying support from the robust corporate earnings and economic performance is preventing the markets from falling further. The robust performance in key sectors such as artificial intelligence and infrastructure investment is acting as a support to the equity markets; however, this is being countered by the geopolitical risks and the sensitivity to the financial markets. As such, the markets are balancing the robust underlying performance with the risks emanating from the geopolitical environment and the financial markets, which is causing the markets to open flat as the direction of the markets is likely to be dictated by the upcoming economic data releases and the policy decisions.
Major Index Performance as of Wednesday, 18 Mar 2026
- Nasdaq: The Nasdaq is trading at 22,645.35, down approximately 0.2%, as pressure on large-cap technology remains.
- S&P 500: The S&P 500 is trading at 6,754.55, down approximately 0.4%, as it faces pressure in terms of valuation and narrow participation.
- Russell 2000: The Russell 2000 is trading at 2,519.99, up approximately 0.7%, as it sees strength in small-cap stocks.
- Dow Jones: The Dow Jones is trading at 46,993.26, up approximately 0.1%, as it sees strength in defensive sectors and industrials.
The Magnificent Seven and the S&P 500
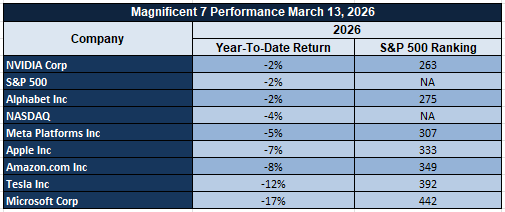
The Magnificent Seven are once again leading the charge in terms of index movement, but it is also these stocks that are creating the pressure. Valuation and interest rate sensitivity are the culprits for the current weakness. These stocks were the drivers of the S&P 500 in the past, but are being reassessed as interest rates remain high. This is creating a situation in which the index appears healthy, but underlying participation is weak. Until such time as we see strength in the broader markets, we are capped in terms of any potential upside.
Drivers Behind the Market Move – Wednesday, March 18, 2026
The US and European markets are currently operating through a complex mix of various geopolitical events, inflation risks, and significant policy announcements. The markets are exhibiting a cautious sentiment that is largely reactive in nature. The markets are currently balancing a mix of robust underlying fundamentals with growing external risks.
- Geopolitics and Energy Supply Risks
The recent spate of policy announcements that signaled a potential exit strategy from military actions, coupled with calls for global cooperation to ensure secure energy supply through key oil shipping lanes, has led to a mixed signals market scenario. The risks emanating from this are that despite the potential reduction in global conflicts, the lack of global cooperation to ensure energy supplies has led to a sharp increase in energy prices. The recent spike in crude oil prices is a significant concern that has pushed energy prices to levels not seen in recent months. The European markets are particularly vulnerable to energy risks due to their reliance on imported energy supplies. The US markets are being impacted through valuation corrections in growth stocks. The markets are not in a full-fledged risk-off mode but remain cautious due to the energy-related uncertainty.
2. Inflation Pressures and Upcoming Economic Data
Markets are highly focused on today’s inflation-related data, particularly the producer price index, as well as key policy decisions and projections. The rise in oil prices is already impacting inflation expectations, and if the upside surprise in the inflation data is larger than anticipated, it would likely reinforce the notion that interest rates are set to remain higher for longer, which would be unfavorable for equity valuations, particularly those that are sensitive to financial markets. On the other hand, if the inflation data comes in softer than anticipated, it would alleviate some of the pressure on the markets, as it would be consistent with the expectation of more stable or even favorable interest rate environments.
3. Policy Signals, Global Coordination, and Market Positioning
The lack of high-level diplomatic efforts to engage with the major global economies, as well as the domestic policy efforts aimed at shoring up the supply chain and supporting key sectors, are likely contributing to the theme of shifting global coordination. However, the strong corporate earnings and economic fundamentals are likely preventing the markets from falling too far, as they continue to provide support to the markets. Hence, it is the interplay of these two forces that is likely impacting the markets, as investors are likely awaiting the key economic and policy signals before taking more risk.
To summarize, the convergence of geopolitical risks, inflation pressures driven by rising oil prices, and the anticipation of key economic and policy signals are likely impacting the markets today, as investors are likely awaiting the outcome of these key events before taking positions in the markets, as evidenced by the mixed and subdued performance in the US and European markets today.
Digesting Economic Data
The TRUMP Tweets and Their Implications
Recent policy moves suggest that there is a possibility of a change in military operations, and there is a possibility that the operations in the Iran conflict may be scaled down in the near future. However, the intense criticism of allied forces for not supporting the operations in the Strait of Hormuz suggests that there is a fragmentation in global coordination. This is important because the Strait of Hormuz is responsible for 20% of global oil flows. Therefore, any change in the security of the Strait of Hormuz is important in understanding the overall impact on oil prices and inflation. Therefore, there is a sense of confusion in recent policy moves. However, markets are unlikely to be impacted in any significant manner because markets are typically cautious in such situations and tend to stick with defensive positions.
However, there is another layer of confusion in recent policy moves because of the delay in diplomatic engagement with China and the rescheduling of such meetings. This is important because global growth is heavily dependent on the coordination of global economies. However, recent policy moves suggest that there is a delay in diplomatic engagement with China. Therefore, there is a possibility that global coordination may be impacted in the near future. However, the overall impact on markets is unlikely to be significant in the short term. However, there is a gradual build-up of uncertainty that may be important in understanding the overall market reaction.
Economic policies, as indicated in these comments, also suggest that there may be a larger strategy in play, focusing on domestic resilience as well. Efforts to secure fertilizer supplies from various regions, as well as efforts to finalize biofuel blending quotas, suggest that there may be an effort to prepare for possible disruptions in global supply chains. This, again, speaks to the larger impact of the ongoing conflict, as disruptions in global energy and shipping routes are already beginning to be felt in global trade flows and inflationary pressures. From an investment perspective, this suggests that inflationary pressures may be longer-lasting than previously thought, particularly as it relates to energy supplies and agricultural inputs.
Finally, the larger political environment, as indicated in these comments, suggests that there may be an effort to focus on domestic stability, as well as the larger geopolitical environment. As it relates to the markets, these developments, while not necessarily moving the markets in isolation, suggest that the larger environment remains quite active, particularly as it relates to the ongoing conflict, supply chain adjustments, and the lack of international coordination efforts. As it relates to the markets, the takeaway here is that these developments are not necessarily suggesting that the markets should be moving in one direction or another; rather, they are suggesting that the environment in which the markets are operating remains quite complex, as geopolitical risks, economic policies, and global coordination challenges are all coming together, supporting the markets in some respects, yet not necessarily providing the level of confidence that the markets would like to see in other respects.
Pending Home Sales Surprise Signals Fragile Demand Rebound
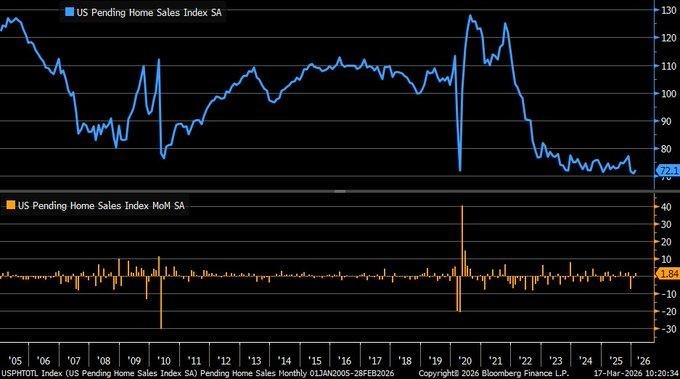
February pending home sales data surprised with a 1.8% month-over-month increase, surpassing market expectations of a decline. This is despite the previous month’s decline, indicating that borrowing costs have eased to their lowest levels in more than a year, thus improving affordability. However, despite the surprise, the data still shows a fragile demand scenario, with the index still near historically low levels while annual sales continue to decline. This is a sign that while lower financing costs can trigger demand, structural issues such as limited housing supply still exist.
From our point of view, this is a rate-sensitive market rather than a fundamentally strong market. Furthermore, analysts should take note that while affordability is currently high, there is a possibility that the decline in borrowing costs could reverse, especially if energy prices continue to climb, thus increasing inflation. This would then impact buyer activity, thus reversing recent trends. Therefore, analysts need to take note of this possibility, especially if inflation continues to increase, thus forcing up borrowing costs. In conclusion, there is a possibility that recent trends could reverse, thus indicating a fragile market.
With regard to the implications of this data, there is a possibility of selective opportunities arising, especially in the case of homebuilding, real estate services, and housing supply chains. However, analysts need to take note that this is not a sign of a strong market, especially with regard to recent trends. Furthermore, analysts need to take note of forward-looking indicators such as contract cancellations, regional demand divergence, and sensitivity to rate movements. Companies that have shown strong pricing power, diverse geography, and strong balance sheets could potentially offer undervalued risk/reward profiles, especially with regard to recent trends. However, this market is highly dependent on interest rate movements.
Equity Outflows Increase as Bond Flows Indicate Defensive Market Rotation
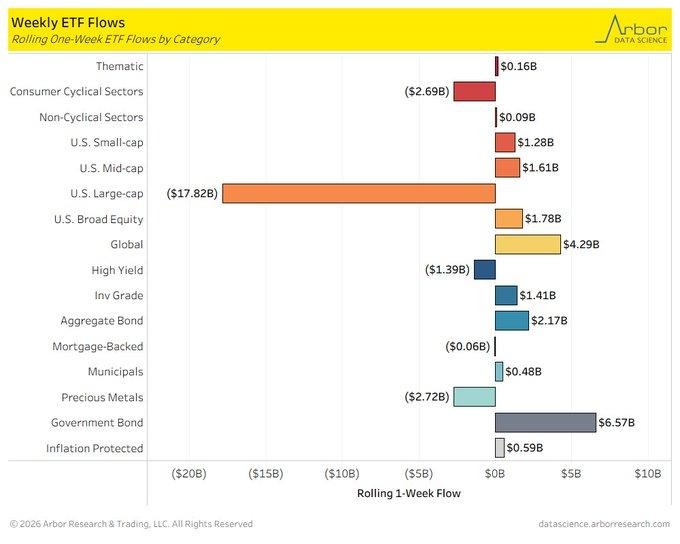
Recent fund flows have indicated a significant $17.8 billion equity ETF outflow in large-cap shares, representing the biggest weekly equity withdrawal since mid-December 2025. Government bonds have seen $6.57 billion in inflows, clearly illustrating a market rotation. This is not an indication of a market exit but rather a defensive rotation as investors are not leaving the market but rather leaving certain segments in favor of safer alternatives. This is an indication that investors are becoming more cautious about the market as a whole, especially in an environment where market volatility is increasing and global market conditions are becoming more uncertain.
The major reason for this rotation is the increased geopolitical tensions in major energy-producing countries. This is resulting in energy supply chain concerns and is leading to an increase in oil prices. This is also leading to an increase in inflationary concerns as a result of higher oil prices. This is a challenging time for large-cap growth stocks as they are extremely sensitive to rising interest rates. At the same time, inflows into the mid-cap and small-cap segments of $1.61 billion and $1.28 billion, respectively, also indicate that the market may not be completely risk-off but could also be indicating a rotation into areas that are perceived as relatively more undervalued and less exposed to global shocks.
Analysts should also track the movements in bond yields, trends in energy prices, and volatility levels as they are likely to impact the sustainability of the current defensive stance. On the above background, we are of the view that there are areas of undervaluation in the mid-cap and small-cap segments of the equities market. These segments are likely to benefit from the rotation of capital as the market seeks relative value outside the crowded large-cap segment. On the other hand, the risks are also significant in case of an escalation of geopolitical risks and an increase in inflationary pressures.
Manufacturing Output Growth Slows but Remains Positive, Indicating Resilient Industrial Cycle
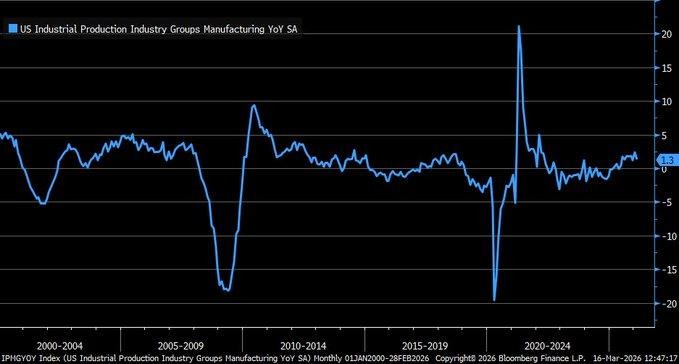
Manufacturing production growth, while slowing, remained firmly in positive territory, increasing by 1.3% year over year in February 2026, down from a stronger increase of 2.4% in January. Industrial production growth, meanwhile, remained strong, increasing by 1.4% year over year. From our perspective, this slowing growth is not a sign of contraction, which is common during economic downturns, but rather a sign of normalization following stronger growth in previous months. Therefore, this is a sign that industrial production is stabilizing rather than overheating.
Looking deeper, one can see that while production growth is slowing, this is partly due to slowing growth in motor vehicle production, which, while increasing by 1.7% year over year, is slowing down compared to previous months. This is a sign that while demand is strong, certain segments of production are slowing down, likely due to normalization of supply chains and diminishing pent-up demand. However, one can see that the industrial base is showing strong signs of resilience, supported by strong production levels across various segments. Analysts should focus their attention on forward-looking indicators such as new orders, capacity utilization, and capital expenditures, as these factors would determine whether this slowing growth turns into a contracting cycle or whether growth levels out to a balanced growth trajectory.
Based on these developments, one can see that there is a high possibility of undervaluation in equities related to the industrial and automation space, especially those that benefit from stable production output rather than relying on growth cycles. Companies that have diversified production segments and high levels of operational efficiency would likely benefit from this phase of growth, where growth is slowing down. Analysts should focus their attention on trends related to order books, pricing power, and production demand levels related to various segments of production, especially those related to industrial production, to determine whether the cycle is extending or whether there is a turning point.
Upcoming Economic Events
Core PPI, Fed Rate Decision, and FOMC Signals for Market Direction
With the macroeconomic calendar reaching a critical stage in the coming days, the markets are closely observing a series of inflation and interest rate decisions that will impact the market’s expectations for interest rates and the overall financial environment. The combination of inflation data and interest rate decisions by the Fed creates a high-impact environment where the markets are closely observing the interest rate environment and inflation data together. These events are expected to impact the market’s sentiment and also influence the overall asset allocation decisions for the markets. Let’s understand how these events are expected to impact the market’s behavior based on the outcomes compared with the expectations.
Core PPI m/m and PPI m/m
Producer Price Index data provides insight into the inflation environment at the producer level. The data reflects the overall inflation environment and its impact on the economy.
- If the Core PPI and PPI data are higher than the market expectations, it reflects an increase in the overall inflation environment. This may impact the interest rate environment as the market may expect higher interest rates. In such a case, the equities may face pressure as the interest rates are expected to rise.
- On the other hand, if the data is lower than the market expectations, it reflects a decrease in the inflation environment. This may impact the interest rate environment as the interest rates are expected to decrease. In such a case, the equities may move higher as the interest rates are expected to decrease.
Federal Funds Rate Decision
The policy rate decision is an important factor in determining market direction.
- If the rates remain unchanged as expected, but forward guidance is seen as tightening, it could result in a negative market reaction as borrowing costs are expected to remain high.
- If the rates surprise on the higher side, meaning the rates are higher than expected, it is expected to result in a negative market reaction as equities fall, and bonds react to the change.
- If the rates are lower than expected, it is expected to result in a positive market reaction, especially for interest-sensitive sectors. Analysts must look beyond the interest rates and also consider the forward guidance, as it is more market-sensitive than the rates themselves.
FOMC Economic Projections, Statement, and Press Conference
The economic projections and accompanying statement provide deeper insight into how policymakers view growth, inflation, and the future path of interest rates.
- If projections show stronger growth and higher inflation expectations, markets may interpret this as a signal of prolonged restrictive policy, leading to pressure on equities and upward movement in bond yields.
- If projections are revised downward, indicating softer growth and easing inflation, this could support risk assets by reinforcing expectations of policy easing over time. The press conference will be critical in clarifying these signals, as tone and language often guide market interpretation.
Analysts should closely monitor changes in inflation forecasts, employment outlook, and rate path expectations, as well as any shift in tone that could redefine market expectations in the near term.
Stock Market Performance
Indexes Rally from Lows, yet Market Breadth Continues to be a Concern
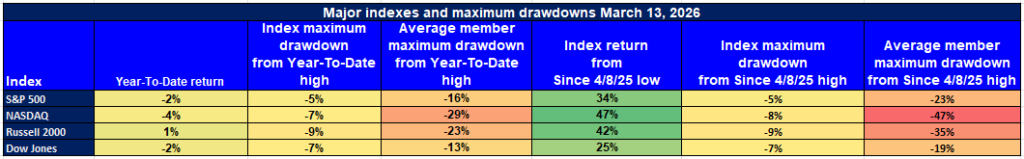
The stock market has rallied significantly from its lows recorded on April 8, 2025. However, it is important to note that there is a significant disconnect between market index performance and market breadth. Despite a significant run from the lows, most major indexes still have negative year-to-date performance. Moreover, average member performance serves to illustrate that underlying market weakness still persists.
Here’s our analysis of recent stock market performance based on various indexes:
S&P 500: Headline Stability Obscures Weak Participation
YTD: -2% | +34% since April low | -5% from YTD high | Avg. member: -16% YTD / -23% since low
The S&P 500 has rallied strongly from its low by 34%. However, it still faces a -2% decline in its year-to-date performance. In our view, this indicates that it has not fully recovered from previous losses. Despite a relatively modest 5% decline from its high, it is evident that weak participation persists in this market. This is a clear indicator that only a select group of large-cap stocks are responsible for this market’s positive performance.
NASDAQ: Robust Rally from Lows; However, Significant Damage Done to Stocks
YTD: -4% | +47% since April low | -8% from YTD high | Avg. member: -29% YTD / -47% since low
The NASDAQ is leading in recovery with a gain of 47% from its April low but is still down 4% YTD. Although an 8% drawdown from its high may be seen as manageable at a surface level, the fact that the average member is down 29% YTD and 47% from its low indicates significant underlying stress. This indicates that while large technology stocks are leading the rally in the NASDAQ, the overall growth space is still experiencing difficulties.
Russell 2000: Positive YTD, But Volatility Remains Elevated
YTD: +1% | +42% since April low | -9% from YTD high | Avg. member: -23% YTD / -35% since low
The Russell 2000 is an interesting case as it is up 1% YTD and has risen by 42% from its April low. Although this is a strong recovery, the fact that it is down 9% from its high and the average member is down 23% YTD and 35% since the low indicates that small caps are still experiencing volatile conditions.
Dow Jones: Defensive Strength with Controlled Drawdowns
YTD: -2% | +25% since April low | -7% from YTD high | Avg. member: -13% YTD / -19% since low
The Dow Jones is also experiencing defensive characteristics as it is down 2% YTD but is up 25% from its April low. A drawdown of 7% from its high is also relatively low compared to the overall market. However, the fact that the average member is down 13% YTD and 19% since the low indicates that even the most defensive stocks are not entirely insulated from market pressures.
At Zaye Capital Markets, we remain cautious about the sustainability of the current market recovery. Although the index is showing good relative strength, the low breadth and large average member drawdowns indicate that the structure of the market is still vulnerable. We recommend maintaining a selective position in good companies with good balance sheets while closely watching the breadth indicators for confirmation of a strong and sustained market recovery.
Earnings
Yesterday’s Earnings Recap: March 17, 2026
- Tencent Music Entertainment Group (TME) reported Q4 2025 revenues of RMB 8.64 billion (US$1.24 billion), an increase of 15.9% year-over-year. Online music services revenue grew 21.7% year-over-year to RMB 7.10 billion (US$1.02 billion). Music subscription revenue increased 13.2% year-over-year to RMB 4.56 billion (US$653 million), and non-subscription music services revenue grew sharply by 40.8% year-over-year to RMB 2.54 billion (US$363 million). Net profit attributable to equity holders of the company increased 12.6% year-over-year to RMB 2.20 billion (US$315 million), with non-IFRS net profit increasing 9.0% year-over-year to RMB 2.49 billion (US$355 million). Total revenues for the year were RMB 32.90 billion, with net income of RMB 11.06 billion.
- Oklo Inc. (OKLO) reported Q4 2025 EPS of -$0.27, which is lower than the expected range of -$0.16 to -$0.17. Revenue reported was $0, as the company is in the pre-revenue stage. Oklo reported significant operational losses in 2025 of approximately $139.3 million and a net loss per share of -$0.58. Oklo’s financial profile is based on reactor developments, payroll, and regulatory progress. Oklo’s valuation is based on reactor timelines and licensing progress, not on earnings.
- Atour Lifestyle Holdings Limited (ATAT) reported Q4 2025 net revenues of RMB 2,788 million (US$399 million), an increase of 33.8% year-over-year. Net income increased 44.7% year-over-year to RMB 478 million (US$68 million). Adjusted net income increased 48.0% year-over-year to RMB 493 million (US$71 million). Adjusted EBITDA increased 58.4% year-over-year to RMB 697 million (US$100 million). Total revenues increased 35.1% year-over-year to RMB 9,790 million (US$1,400 million), with net income of RMB 1,621 million (US$232 million).
- Corporacion America Airports SA (CAAP) has announced consolidated revenues of $464.8 million in Q4 2025, growing by 17.3% year-over-year, with a 17.4% increase in aeronautical revenues and 16.3% growth in commercial revenues. Adjusted EBITDA has grown by 39.8% to $210.7 million, backed by 9.1% growth in passenger traffic. Consolidated revenues for 2025 were $1,756.4 million, growing by 8.4%, with adjusted EBITDA growing by 15.0% to $715.5 million. Passenger traffic has reached a new record of 86.7 million, growing by 9.8%.
Earnings Due Today Preview – March 18, 2026
- Micron Technology (MU) is set to provide significant insights into the semiconductor industry, with focus on various aspects such as memory pricing, inventory, and demand with respect to data infrastructure as well as artificial intelligence-related workloads. The company is set to provide significant forward-looking information on whether this industry cycle is improving or slowing down.
- Prudential plc (PUK) is set to provide significant information on various aspects such as insurance as well as asset management business performance. The company is set to provide significant forward-looking information on various aspects such as interest rates, as this would be a significant factor with respect to customer demand as well as premium sales.
- Earnings reports from Jabil Inc. (JBL) are expected to give an indication of the global manufacturing and supply chain environment, with investors looking at trends in visibility, margins, and overall exposure in important industries such as electronics and industrial. JBL’s quarterly report is expected to be an indicator of overall industrial production and demand stability.
- Investors expect Williams-Sonoma (WSM) to provide insight into consumer discretionary spending, with a focus on same store sales results, inventory management, and pricing power. Investors will want to know whether consumers are continuing to spend or whether they are beginning to cut back, particularly in more premium lifestyle markets.
Stock Market Overview – Wednesday, 18 Mar 2026
The US stock market is trading with a cautious tone, with investors reacting to the rise in oil prices, geopolitical tensions in key energy-producing countries, as well as concerns about interest rates. The market is not breaking down, but the confidence is low. The capital is moving, not exiting, with defensive sectors gaining traction, while high valuation growth stocks are under pressure again. At Zaye Capital Markets, we see the market as stable at the surface, with underlying fragility driven by inflation sensitivity and leadership risks.
Stock Prices
Economic Indicators and Geopolitical Developments
The market tone today is driven by the rise in energy prices, with policy uncertainties adding to the mix. The disruption in the global oil supply routes is pushing inflation rates, which could cause interest rates to stay high for longer. This is affecting the overall stock market valuations, especially in growth stocks. At the same time, the market is positioning itself ahead of key policy announcements, which are expected to guide the future direction of the economy, thereby defining the future direction of the overall financial markets.
Latest Stock News
- $NVDA | Nvidia is the focus of the market, with the company announcing that it is expected to earn $1 trillion in cumulative revenue from AI chips by 2027, driven by the accelerating demand for advanced computing solutions. In addition, the company is expected to benefit from the expected $650–700 billion in AI infrastructure spending by large tech companies in 2026, with Nvidia leading the pack. Despite the strong growth prospects, the stock is not showing much movement, with investors concerned about the future returns justifying the current expectations.
- $UBER | Uber Technologies stock rose as the company announced its expansion of its partnership with Nvidia to implement its autonomous robotaxi fleet in 28 cities.
- $META | Meta Platforms is facing pressure as reports of delays and issues with its next-generation artificial intelligence technology have started to surface. While the company still aggressively invests in its AI technology, execution issues are starting to creep in.
- $TSLA, $GOOGL, $MSFT, $AMZN, $NVDA, $PLTR | Some of the major technology companies are dealing with geopolitical risks as the situation in key regions continues to evolve and affect the global operations and infrastructure of these companies. Despite this, the technology sector as a whole seems to be doing well as the market digests the geopolitical risks due to energy price increases.
- $NVO, $HIMS | Both Novo Nordisk and Hims & Hers announced that they entered into a partnership agreement in the obesity treatment market.
- $PLTR | Palantir is still a part of the larger narrative revolving around artificial intelligence as the company faces the reality of capital outflows from high valuation technology stocks as investors are more aware of valuation risks within the sector.
- $AMD | AMD is quiet on any firm-specific news but remains a beneficiary of the overall strength in semiconductors driven by artificial intelligence demand, indirectly aided by investment growth in the sector.
The Magnificent Seven and the S&P 500

The Magnificent Seven are once again leading the charge in terms of index movement, but it is also these stocks that are creating the pressure. Valuation and interest rate sensitivity are the culprits for the current weakness. These stocks were the drivers of the S&P 500 in the past, but are being reassessed as interest rates remain high. This is creating a situation in which the index appears healthy, but underlying participation is weak. Until such time as we see strength in the broader markets, we are capped in terms of any potential upside.
Major Index Performance as of Wednesday, 18 Mar 2026
- Nasdaq: The Nasdaq is trading at 22,645.35, down approximately 0.2%, as pressure on large-cap technology remains.
- S&P 500: The S&P 500 is trading at 6,754.55, down approximately 0.4%, as it faces pressure in terms of valuation and narrow participation.
- Russell 2000: The Russell 2000 is trading at 2,519.99, up approximately 0.7%, as it sees strength in small-cap stocks.
- Dow Jones: The Dow Jones is trading at 46,993.26, up approximately 0.1%, as it sees strength in defensive sectors and industrials.
At Zaye Capital Markets, we maintain a selective stance. This is not a broad risk-on environment—it is a positioning market shaped by inflation risk, geopolitical tension, and valuation sensitivity. Until participation broadens and pressure from borrowing costs eases, market stability is likely to remain fragile beneath the surface.
Gold Price: Gold Price Outlook Today – Inflation, Fed Policy, and War Risks
Spot gold prices are currently trading at $4,992.28 per ounce, holding around the crucial $5,000 mark after briefly touching new highs of $5,040. The prices are looking bullish, as they are trading way above the long-term average of $2,597, thus indicating that this is not a short-term surge but rather a long-term trend. However, the momentum indicator is also on the higher end, with the RSI approaching the overbought region, thus indicating that though the trend is bullish, the prices are entering a region where the upward momentum might slow down. The current prices are a result of the balancing act between the uncertainty in the global arena and the overall financial situation. Recent policy indications of reducing the scale of military interventions, along with calls for international cooperation in securing key energy routes, have not reduced uncertainty but rather altered it. Thus, the current situation is favoring gold as a store of value, but not in an uncontrolled manner, as the rise in energy prices is being reflected in inflationary pressures and thus keeping borrowing costs elevated.
Looking forward, economic data such as Core PPI, headline PPI, and communication will be key drivers that will influence the next move in gold prices. If inflation is seen to be moving higher, this will add to the concerns that are already being fueled by energy prices. As a result, borrowing costs will be pushed even higher, leading to a downward move in gold prices despite underlying demand. Yesterday’s economic landscape has already seen a move towards defensive positioning, with capital moving away from riskier assets and cementing gold’s position as a defensive asset. One thing that is clear both from the macroeconomic landscape as well as the structure on the charts is that gold is not moving randomly. It is moving at a point that is critical, with various economic drivers affecting it. The next move will be determined by the economic force that gains control, but one thing is clear: unless there is a significant change in inflation dynamics as well as global risk conditions, the underlying trend is still very much supportive.
Oil Prices: Oil Price Outlook Today – Supply Risk, Fed Policy, and Demand Pressure
The current prices of crude oil are trading at $98.42 per barrel for Brent crude oil and $94.17 per barrel for WTI crude oil. These prices are hovering just below the $100 per barrel mark after recent price volatility that saw prices touch this significant price point. The prices, therefore, reflect a market that has reacted significantly to recent supply risks but is now consolidating as traders seek a balance between risks and demand. The main cause of this situation is the geopolitical tension in critical crude oil transport routes, especially the Strait of Hormuz, which transports a significant volume of crude oil. Recent indications that a reduction in military action is imminent in this area have led to temporary relief in crude oil prices. However, calls by various countries to ensure that this area is secured through international cooperation indicate that this situation is not resolved. It is because of this reason that crude oil prices are not falling significantly despite this de-escalation. Recent market comments on crude oil prices also reflect that there is still significant sensitivity to crude oil transport risks, thereby indicating that supply risks are still a significant part of crude oil prices.
In terms of oil specifically, we see that it is being driven by a second major force, namely demand based on inflation and financial conditions. The general markets yesterday showed that there was a shift occurring towards more defensive positioning. The rising energy costs were feeding into the inflation concerns. This has created a situation where oil prices rising cause an increase in inflation, and this then feeds into an increase in borrowing costs and eventually starts to affect economic activity. The economic data today becomes very important. If the inflation comes in higher than expected, then this will simply reinforce that energy costs are feeding into the broader inflation. This will be positive for oil prices in the near term but will also start to cause problems for demand as borrowing costs increase further. On the other hand, if the inflation comes in softer or if there is an indication of less aggressive policy, then this could actually help support economic activity and oil demand. The key point here is that oil is no longer being driven by one single factor. Instead, it is being driven by supply and demand. The next move for oil will be determined by whichever of these factors is more dominant. However, the key point is that oil is still at an elevated price based on supply concerns and is also becoming increasingly sensitive to demand.
Bitcoin Prices: Bitcoin Price Outlook Today – Fed Policy, Liquidity and War Risk
Bitcoin is currently trading at $74,225 as it holds its position near its recent highs as the price tests the levels above $76,000, as confirmed by the latest chart structure. The price is still holding its upward trend as the price trades well above its long-term average of $59,094, which confirms that this is not just a short-term price surge but is actually part of the long-term upward trend. However, the momentum in the price of the asset has slowed down as the RSI is at 34, which confirms that the price has moved out of the overbought zone and is now just holding its position as the price tries to stabilize after its recent surge. The price surge in the asset can be attributed to the various factors that are at play in the market right now, including the technical and structural factors such as the sentiment, short liquidations, and derivatives, which have all accelerated the upward momentum in the price of the asset. The geopolitical risks are also having a significant impact on the price of the asset as the ongoing tensions between the global economies are keeping the price of the asset high as the tensions regarding the global conflicts and the delayed diplomatic engagements are still ongoing, which is keeping the price of the asset high. Even the recent signals that the military risks are likely to reduce have not had any effect on the price as this has only changed the risks but not removed them altogether.
From the macro and policy perspective, the price of Bitcoin is increasingly related to global liquidity trends and economic expectations instead of moving independently. Yesterday’s economic environment was characterized by a general shift towards defensive positioning in the traditional markets, which helped support the role of Bitcoin as a diversification and alternative store of value asset, similar to gold but with greater volatility. On the other hand, future expectations are heavily reliant on the current economic data and trends. If the inflation data is higher than expected, this could exacerbate the pressure on borrowing costs, which could cause the price of Bitcoin to decline in the short term due to the reduction in liquidity. If the inflation data is lower than expected or the global economic trends are less aggressive than anticipated, this could cause the price of Bitcoin to appreciate further due to the improved economic conditions and continued support from the global appetite for the asset class. Additional analysis of the market trends suggests that the price of Bitcoin could potentially range from $58,000 in the context of a recession scenario to as high as $165,000 with high adoption and supportive trends. However, the base case scenario suggests that the price of Bitcoin could range-bound between $70,000 with limited progress in terms of regulation trends. The key takeaway from this analysis is that the price of Bitcoin is no longer driven by internal crypto trends but is instead at the nexus of geopolitical risks, global liquidity trends, and regulation trends, with the next direction of the price of Bitcoin heavily reliant on which of these factors dominates the market trends.
ETH Prices: Ethereum Price Outlook Today – ETF Flows, Whale Moves, and Supply Trends
Ethereum is trading at $2,331, holding up below the recent high of $2,386 and slightly below the long-term average of $2,434, as indicated by the latest structure in the charts. This indicates a stabilization in the market after a strong run-up, as opposed to a bearish move, with the RSI at 38, which indicates a loss of momentum after being in an overbought state. The trend remains bullish, as indicated by the fact that the price is holding up in an established range rather than breaking down. In terms of ETF flows, the past week has seen institutional flows related to Ethereum exposure holding up, with periods of inflows and profit-taking. This indicates that institutions are not exiting the space, but rather adjusting their exposure around key levels. This is not a situation in which the market is lacking demand, but rather in which it is entering a phase in which supply and demand are temporarily balanced, resulting in consolidation around these prices.
At the same time, on-chain data continues to emphasize the growing impact that whale influence is having on the price structure of Ethereum. Whale accounts have been accumulating during dips and have been distributing their holdings in the areas where there is resistance. This is a controlled environment where there is support on the upside but also a ceiling. A substantial amount of Ethereum is continuing to be staked, which is reducing the circulating supply and providing a floor on the price. However, there are intermittent periods where large volumes are being moved to exchanges, which is providing the selling pressure that is preventing the price from breaking higher. Essentially, the takeaway is that Ethereum is in a period where it is supply-constrained but also resistance-limited. Therefore, the price is going to be supported on the downside but limited on the upside. However, the direction that the price is going to take in the future is dependent on whether the inflows and accumulation are greater than the distribution. However, at the moment, it is a market that is in a period of accumulation and not in a period of decline.
