Where Re Markets Todays?
European and U.S. stock futures are trading near the flat line today. U.S. stock futures tied to the Dow Jones Industrial Average are slightly lower. Futures tied to the S&P 500 and Nasdaq 100 are slightly below the flat line. European stock futures are also quiet. This is because investors are reacting to the positive session in the U.S. stock market while awaiting catalysts like earnings reports from big retailers and economic data releases like weekly jobless claims and housing data. This is the reason stock futures are trading near the flat line.
The reason stock futures are trading near the flat line is the uncertainty over the future of monetary policy. The minutes of the Federal Reserve’s January meeting showed Fed officials were divided over the future course of interest rates. This has fueled the debate over whether the Fed will maintain higher interest rates for a longer period of time. This has kept the yields of bonds high enough to pressure growth stocks like technology companies while still supporting riskier investments like financials and energy companies. European stock futures are also reflecting the same. This is because investors are reacting to the resilience of the overall economy while awaiting the impact of inflation and currency movements on the earnings of multinational companies.
Another factor that is contributing to the subdued futures markets is the geopolitical risk and the movement in commodity prices. Oil prices have moved up significantly in recent times as tensions in the Middle East have increased. This is providing an inflationary bias to the markets and is also causing an increase in energy sector shares. However, it is also causing caution in rate-sensitive sectors. In addition to this, investors are also keeping a watchful eye on Walmart’s earnings announcement as it is a leading indicator of consumer health and any reaction in this sector will have an impact on the entire market.
At Zaye Capital Markets, we believe that the flat futures markets are a result of the macro balance that is being maintained in the economy as economic indicators are strong enough to prevent risk-off positions but the uncertainty in policies and geopolitical events is preventing any breakout in the markets. The markets will need to see clearer signals from labor, housing, and inflation data to move sustainably higher and see stability in energy markets and confirmation that earnings are growing to sustain current valuations.
Major Index Performance as of Thursday, 19 Feb 2026
- Nasdaq Composite: The Index is trading around 22,700 levels, largely impacted by the movements in the mega-cap technology stocks and the underlying strength in the semiconductor sector.
- S&P 500: The Index is trading around 6,880 levels, largely impacted by the sector rotation into cyclicals and commodities.
- Russell 2000: The Index is trading around 2,650 levels, showing relative strength as capital flows into small-cap stocks.
- Dow Jones Industrial Average: The Index is trading around 49,600 levels, largely impacted by the underlying strength in industrial and energy sectors.
The “Magnificent Seven” and the S&P 500
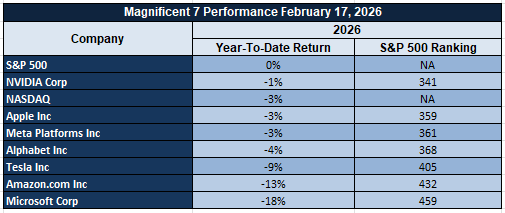
The Magnificent Seven: Apple, Microsoft, Nvidia, Amazon, Meta Platforms, Alphabet, and Tesla, continue to be key drivers of the markets’ direction. The recent swings in the markets have been due to a re-pricing of valuations as opposed to any underlying structural issues in the economy. Nvidia and Microsoft are benefiting from the underlying strength in artificial intelligence infrastructure demand, while Meta Platforms’ acceleration in advertising is providing positive earnings momentum. However, the underlying stress in the group continues to be a negative factor in the S&P 500 Index due to their high weighting in the Index.
Drivers Behind the Market Move – Thursday, 19 February 2026
The U.S. and European markets are opening today in a measured and data-driven fashion, as investors seek to process a mix of fresh data, active policy engagement emanating from the White House, and growing international crosscurrents. There is nothing in the price action to suggest either risk-off fear or risk-on enthusiasm. Rather, the markets are reacting to three well-defined forces currently at play in the markets, which are influencing equities, commodities, and bond markets.
1. Labor, Manufacturing, and Housing Data Driving Rate Outlook
The data points in the U.S. today, including the release of the nation’s unemployment claims, the Philly Fed Manufacturing Index, and Pending Home Sales, are critical in defining the direction of the markets. Yesterday’s strong industrial and capital expenditure data helped reinforce the notion of a strong and enduring economy, which has set the stage to revisit the possibility of rate cuts. If the unemployment claims are low and the Philly Fed Index indicates a growing manufacturing sector, it will reinforce the notion of a higher-for-longer rate outlook, which will support the dollar and cyclical stocks, while hurting rate-risk growth stocks. If the data disappoints, the rate cut scenario will be quickly reinstated, which will boost the markets and compress bond yields. European futures are mirroring the sensitivity in the U.S. markets, as the global capital markets are closely correlated to the rate outlook adjustments in the U.S.
2. Policy Engagement Around Issues of Supply Security and Defense Preparedness
The most recent actions taken by the President, including the executive order on prioritizing the domestic elemental phosphorus supply and defining it as vital to the national defense readiness, are further emphasizing the issues of strategic materials security and industrial resilience. Although the general public discourse has been focused on the religious celebrations and the domestic initiatives, the markets have been more focused on the underlying structural implications, including the prioritization of the supply chain, the implications for the national defense, and the fiscal interventions through signed resolutions.
3. Geopolitical Coordination and Commodity Volatility
The recent events and developments surrounding the multilateral diplomatic efforts, pledges for reconstruction, and stabilization efforts have maintained geopolitical risks within the market pricing structure. The recent volatility in oil prices can be directly linked to the geopolitical events, and the increase in the oil prices has been beneficial to the energy sector equities, while at the same time adding inflationary pressures to the rate expectations. The European markets have been more focused on the geopolitical events and the recent developments in the oil and energy sectors, and the current market dynamics can be defined more in terms of the crosscurrents, wherein the sectoral movements, rather than the underlying trend in the markets, are defining the current market movements.
As Zaye Capital Markets, we can confirm that the above factors are based on the developments that have taken place between yesterday and today morning, and the markets are currently being driven by the factors including the recalibration of the economic data, the strategic policy messaging, and the geopolitical risks, and all these factors are currently active and updated, and are influencing the markets today.
Digesting Economic Data
The TRUMP Tweets and Their Implications
The President’s recent communications appear to be heavily focused on faith observances, cultural messaging, and domestic institutional priorities. For instance, the President’s communications about Ash Wednesday and the period of Lent appear to be focused on prayer, faith, and charitable institutions. In another instance, the President’s communications about Black History Month appear to be focused on economic opportunity, education initiatives, and tax relief and child savings account programs. From a market perspective, the President’s communications do not appear to be introducing direct fiscal or monetary policy changes. However, the continued emphasis on tax relief and economic opportunity appears to be supportive of a pro-growth market environment.
In addition to the President’s communications, the President’s policy actions appear to be having a significant impact. For instance, the President’s signing of congressional resolutions, including one nullifying the District of Columbia tax measure, appears to be having a significant impact. Perhaps more significant, the President’s executive order on the domestic supply of elemental phosphorus, which was described as supporting national defense readiness and prioritizing materials and services to support supply security, appears to be having a significant impact. In this instance, the market appears to be benefiting from a broader industrial security strategy, which could be supportive of domestic mining, defense contractors, and specialty chemicals. Supply security policy appears to be having a significant impact, including inflationary pressures.
On the geopolitical side, there have been efforts to schedule a Board of Peace meeting with over 20 countries, pledges in the billions to rebuild Gaza, and personnel commitments to stabilize Gaza. While this could be a positive in terms of geopolitical risks subsiding, it also indicates continued fiscal commitment on a global scale. Finally, there have been comments on international agreements and recognition of ongoing domestic political negotiations, such as the government shutdown. Overall, February 18 has been characterized as a busy day in terms of both domestic and foreign policy. While there have been a number of announcements, there have been no major shifts in policy. The announcements regarding supply security, defense readiness, fiscal policies, and international diplomatic efforts suggest a governance model focused on strategic resilience.
Overall, there have been a number of announcements on February 18, but from an investor perspective, there are a number of trends emerging in terms of industrial security, fiscal policies, and international cooperation. While these have not had a major market-moving effect, investors should be aware of these trends in terms of their long-term effects on defense-related equities, materials, or safe-haven assets.
Foreign Treasury Holdings Rise to $9.4T as Debt Increases to $38.6T
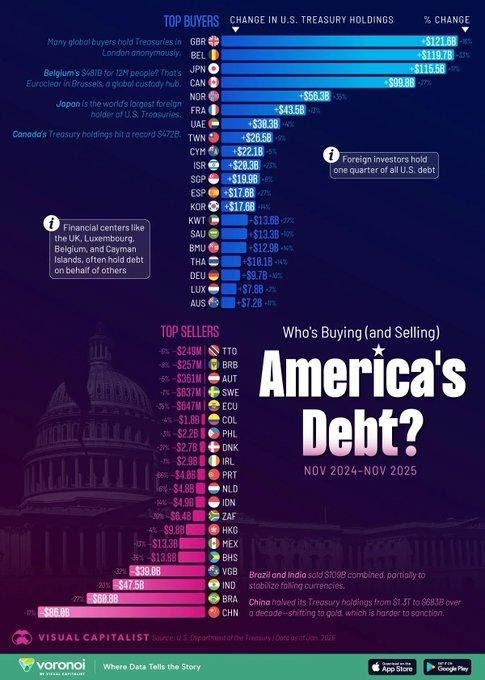
Foreign holdings of government debt rose to a record $9.4 trillion in November 2025. This is an increase in the amount of cross-border capital flowing to the debt market. This increase was fueled mainly by net purchases made through the major financial centers of Europe and the United Kingdom. There was also a resumption of purchases made by Japan. This is an indication that the debt market is still considered a cornerstone of liquidity for global institutions. This is despite the rise in debt levels. It is also an indication of the structural demand for government debt held by the markets. This has helped to keep borrowing costs under control.
At the same time, China has cut its net investment positions by $86 billion over the year, continuing its long-term trend of diversification, which has resulted in a reduction of its net investment positions by half since 2015. Other emerging economies are also selling their debt positions to support their weakening currencies, which clearly indicates that sovereign debt markets are increasingly acting as a tool for reserve positions and policy instruments. As the total public debt currently stands at $38.6 trillion and projected deficits for the current fiscal year are around $1.9 trillion, the sustainability of public debt remains a major concern.
Under this macroeconomic environment, we believe BlackRock Inc. (BLK) is undervalued compared to its long-term earnings potential. Being one of the largest asset management companies in the world, with significant presence in fixed-income exchange-traded funds and sovereign bond instruments, the company will continue to reap the benefits of increased institutional investments in government debt instruments. Increasing debt supply will directly contribute to higher assets under management in bond instruments, especially in a structurally higher-yield environment. Analysts need to track fixed-income investments, fee pressure, and changes in bond durations to estimate revenue growth in bond instruments.
Industrial Production Jumps 0.7%, Manufacturing Strengthens Broadly
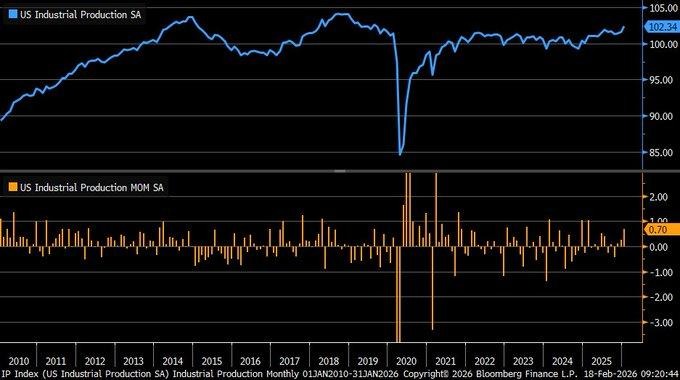
Industrial production rose by 0.7% month-over-month in January 2026, well above the 0.4% increase forecasted and up from the 0.2% increase in December 2025. The industrial production index increased to 102.3 from 101.6 in the prior month. The increase in industrial production was led by manufacturing, which rose by 0.6%, the largest increase since early 2025. We view this as concrete evidence that hard industrial production data is improving in contrast to soft survey data. The increase in industrial production is not a one-time inventory build but points to underlying strength in manufacturing activity, particularly in durable manufacturing categories that relate to domestic demand.
Industrial production rising by 0.7% in January 2026 signifies that businesses are continuing with their production plans as scheduled despite earlier concerns regarding inventory normalization. If industrial production sustains this momentum in the coming months, it will be a positive sign that industrial production capacity utilization will increase in the coming months. Rising industrial production will be positive news for manufacturers with cyclical business models but will increase the probability that interest rates will remain high in the coming periods as rising industrial production will increase inflation rates.
In this scenario, we believe that Emerson Electric Co. (EMR) is an undervalued bet in comparison to the rising industrial production scenario. The company’s business is related to automation and industrial control systems and process optimization solutions that will be positively impacted by rising industrial production in the coming periods as manufacturers will look to increase efficiency without increasing labor costs in the coming periods.
Core Capital Goods Orders Climb 0.6% as AI Investment Continues to Hold Strong
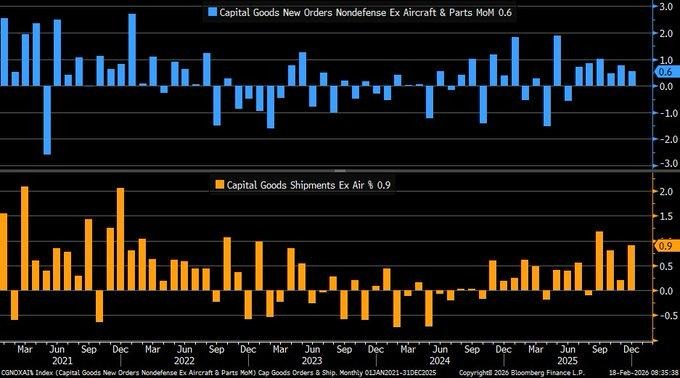
Core capital goods orders increased by 0.6% month over month in December 2025, surpassing analysts’ estimates and reinforcing the narrative of strong business equipment investment. This metric, which serves as a proxy for business investment plans, indicates continued investment in machinery, computers, and infrastructure associated with digital growth. These orders increased by 0.9%, significantly higher than the previous increase of 0.2%. This indicates strong business investment in equipment, providing upside potential for growth estimates in the last quarter of 2025. Despite the 1.4% decline in durable goods orders, the resilience in core capital goods orders indicates that business investment remains strong, despite surface volatility.
The contrast between durable goods orders and core capital goods orders serves as a reminder that transportation orders need to be separated from capital expenditure orders. Orders in primary metals increased by 1.7%, supporting the narrative that industrial supply chains are improving, not deteriorating. Strong orders in core capital goods indicate that businesses are not only ordering equipment but are also actively investing in equipment, which directly contributes to growth estimates. Nevertheless, increased business investment in capital goods could impact monetary policy if business investment momentum supports higher growth estimates.
Under this context, we consider Emerson Electric Co. (EMR) undervalued in relation to its exposure to industrial automation and process technology. As capital investment increases in industrial and digital growth, companies that specialize in industrial control systems and process technology will experience increased equipment integration, given the increase in capital investment in machinery and computers. Its diversified business portfolio in the energy, industrial, and manufacturing sectors provides a higher degree of earnings predictability in relation to capital investment cycles.
Durable Goods Dip 1.4%, Core Orders Signal Underlying Strength
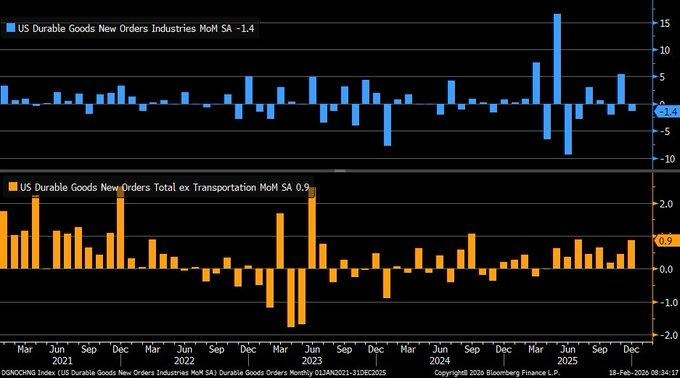
In the recent data release, durable goods orders dipped by 1.4%, a lesser decline compared to the anticipated 2%. In the previous month, durable goods orders increased by a robust 5.4%. When adjusted for the transportation segment, orders increased by 0.9%, a figure considerably higher than the anticipated 0.3%. We find the contrast between the two sets of data to be particularly important, as the transportation segment often skews the overall data. We find the steady increase in core orders to be a positive indicator of the business investment trend. We believe the steady increase in ex-transportation orders indicates a robust underlying trend in business investment. Although the seasonally adjusted data show fluctuations in overall orders, the overall capital goods trend appears to be robust. We find the resilience in core orders to be consistent with the idea that business investment in equipment and machinery has not weakened. We believe the steady increase in overall orders reduces the likelihood of a recession in the near term and indicates continued production activity in early 2026. We find the volatility in overall orders to be a consideration in near-term market sentiment, especially in rate-sensitive areas. We find the increase in core orders to be a positive indicator of overall yield, as it suggests continued overall economic activity. We believe analysts should monitor shipment data, as well as the inventory-to-sales ratio and the business investment component of overall growth, to confirm the trend in core orders.
In the current market, we find Emerson Electric Company (EMR) to be undervalued based on its exposure to the industrial automation and process business. We find the steady trend in capital goods demand to be a positive indicator of the overall business trend in the industrial automation and process business. We believe analysts should monitor the trend in business investment in the industrial sector, as it will have a positive impact on the overall trend in the industrial automation and process business. We find the trend in the industrial sector to be positive, as the sector is shifting its focus to productivity increases rather than hiring more employees.
Housing Starts Surge 6.2% – Permits Climb 4.3%
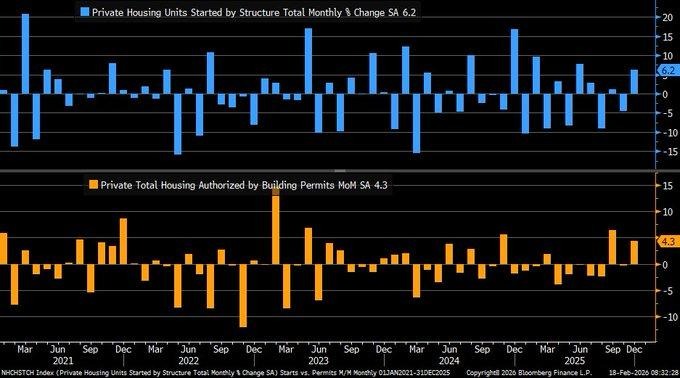
According to the latest data, December housing starts increased 6.2% compared to the prior month, reaching a seasonally adjusted rate of 1.404 million, far exceeding expectations of a marginal increase. Building permits also accelerated 4.3% to 1.448 million, well above expectations and ending the prior trend of decline. We see the combined acceleration in housing starts and building permits as an early indication that the pace of residential construction activity is gaining momentum again. This follows a 3.6% decrease in building permits in 2025, and the latest results suggest that new construction pipelines are likely to emerge in early 2026.
The increase in building permits, in particular, is noteworthy, since building permits are often considered a leading indicator of housing starts and construction activity in the following months. Builders generally obtain building permits when they expect sustained demand, not just a short-term increase in demand. The increase in housing starts and building permits indicates that builders expect demand to increase in the coming months, and they are positioned to meet that demand in the future. Therefore, we see the latest results in building permits and housing starts as a positive indication that the pace of residential construction activity will pick up in the coming months.
Considering the above, we see Builders FirstSource Inc. (BLDR) as undervalued compared to the improving trend in residential construction activity. The company supplies building materials, prefabricated products, and construction services to home builders, and its results directly benefit from the increase in housing starts and building permits. The increase in housing starts and building permits will likely result in a recovery in the pace of construction activity, and that will benefit the company’s results in the coming months.
Global Equity ETF Inflows Exceed $11B as Funds Rotate Abroad
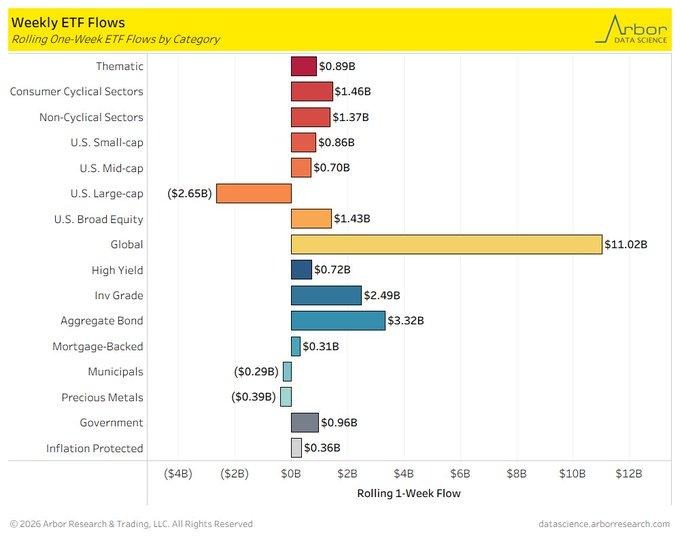
The weekly fund flow data indicates $11.028 billion inflows into global equity exchange-traded funds. On the other hand, U.S. large-cap exchange-traded funds recorded a $2.658 billion outflow. We believe this rotation should be viewed as a diversification trend rather than risk aversion. This indicates that capital rotation into international markets and non-mega-cap segments is gaining traction. On the flip side, U.S. small-cap exchange-traded funds recorded $0.868 billion inflows. Furthermore, mid-cap exchange-traded funds recorded $0.70 billion inflows. Lastly, broad equity categories recorded $1.438 billion inflows. This indicates that investor optimism remains intact but leadership is becoming increasingly diversified beyond large-cap segments.
The significant difference in inflows and outflows indicates a change in market positioning. This indicates that mega-cap valuations are compressing or consolidating. As a result, investors are likely seeking earnings growth in under owned segments. Furthermore, bond exchange-traded funds recorded $3.32 billion inflows. This indicates a balanced allocation trend rather than risk-taking. This indicates that fixed income continues to act as a hedge against macro uncertainty and fiscal policy. Analysts should be focused on tracking international exchange-traded funds, earnings revisions in small and mid-cap segments, and sector leadership to determine whether this trend becomes a structural rotation.
In this backdrop of exchange-traded funds allocation trends, we believe BlackRock Inc. (BLK) is undervalued based on its diversified global exchange-traded funds platform. As capital continues to rotate globally and across market capitalization segments, asset managers with diversified global exchange-traded funds and bond exchange-traded funds stand to gain from asset allocation trends. This indicates that BlackRock Inc. (BLK) should be viewed as a key player in the asset management space.
Empire CapEx Index Jumps to 18.2, Signals Investment Revival
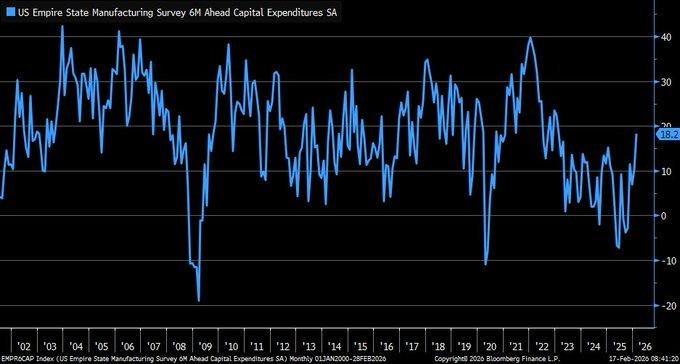
The regional manufacturing survey for February revealed that the six months ahead capital expenditures index jumped significantly to 18.2, its highest level in early 2023, and a notable increase from 10.2 in January. This increase, after declining into negative levels in late 2024, indicates a significant shift in forward-looking investment plans. We regard this as a significant confidence indicator, as manufacturers are planning to increase or upgrade their facilities, as opposed to merely maintaining existing levels of production.
The moderate inflation and steady employment levels appear to be providing a boost in planning visibility, allowing companies to reconsider delayed projects. This increase in investment plans should be viewed in the context of a diffusion index, which measures anticipated capital expenditures and provides early indications of future production capacity and equipment needs. If realized, this increase in capital expenditures could indicate a boost in orders for machinery, equipment, and other industrial materials in the coming months. Analysts should keep a close eye on actual orders for core capital goods, regional shipment data, and earnings guidance for confirmation of this trend.
Under this context, we consider Emerson Electric Co. (EMR) undervalued compared to the improving investment plans. EMR has significant exposure to industrial automation, process control, and intelligent infrastructure, all of which are directly correlated with upgrading factory floors in response to investment plans. As companies aim for productivity and business resiliency, they could increasingly turn to automation and other efficiency solutions, providing a boost in demand for EMR products and services.
Upcoming Economic Events
Unemployment Claims, Philly Fed Manufacturing Index, Pending Home Sales m/m
As we head into the next series of economic releases, the market is trying to balance the resilience of growth with the sensitivity of policy. Labor market releases, regional manufacturing activity, and housing demand all offer clues to whether the economy is accelerating, consolidating, or slowing. Given the sensitivity of bonds to economic releases and the rotation of leadership within the stock market, these releases have both short-term positioning implications and medium-term policy implications. We outline how we think the market will react to the releases both within and outside of the realm of the data’s potential outcomes.
Unemployment Claims
- A decrease in weekly unemployment claims below the forecasted level would likely reinforce the view of a strong labor market with stable income growth. This would likely have the overall impact of supporting the view of the resilience of consumer spending. This would likely have a positive impact on the stock market, particularly for the retail and financial sectors. However, a strong labor market would likely have the impact of keeping inflation higher for longer. This would likely have the impact of pushing up interest rates.
- A rise in weekly unemployment claims above the forecasted level would likely have the impact of signaling a slowdown in employment growth and potentially impacting income growth. This would likely have the impact of impacting the stock market’s perception of discretionary spending. This would likely have the impact of pushing investors towards safe-haven assets like utilities and healthcare. This would likely have the impact of pushing down interest rates.
Philly Fed Manufacturing Index
- If the Philly Fed Manufacturing Index comes in higher than expected, this would suggest improvements in order flows, production schedules, and business confidence in this region. This could have a positive effect on industrial, materials, and capital goods stocks. It could also have a positive effect on higher-yielding bonds because this growth could be accelerating, reinforcing confidence in a stabilization in manufacturing data, which is to be released nationwide.
- If this data comes in lower than expected, this could suggest continued weakness in this region’s production and orders. This could have a negative effect on industrial stocks, particularly those sensitive to short-term orders. This could also have a negative effect on bond yields because this growth could be slowing down.
Pending Home Sales m/m
- If pending home sales come in higher than expected, this could suggest a continued improvement in buyer engagement and housing demand. This could have a positive effect on homebuilders and construction suppliers. This could also have a positive effect on financials related to mortgages.
- If pending home sales come in lower than expected, this could suggest continued weakness in housing demand. This could have a negative effect on homebuilders and construction suppliers. This could also have a positive effect on bonds because this growth could be slowing down.
Stock Market Performance
Indexes Rebound Sharply from April Lows, But Year-to-Date and Internal Drawdowns Reveal a Deeper Structure
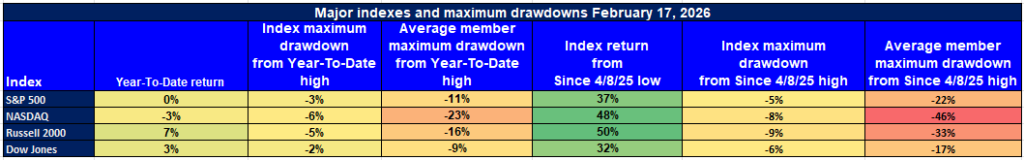
We at Zaye Capital Markets have noticed a strong rebound in the major indices since the low of April 8, 2025. Yet, as we drill down into the year-to-date and internal drawdowns, we find a more complex structure underlying the strong rebound in the major indices. We have found that while the rebound in the major indices has been strong, the average member of the indices has seen a different picture. This contrast between the strong rebound in the major indices and the internal volatility of the averages has been the defining characteristic of the market.
S&P 500: Flat Year, Strong Rebound, Moderate Internal Stress
YTD: 0% | +37% since 4/8/25 low | -3% max drawdown YTD | Avg. member: -11%
The S&P 500 has remained flat year-to-date, yet has rebounded strongly by 37% since the low of April 8, 2025. In addition, the S&P 500 has seen a limited -3% maximum drawdown from its YTD high. Yet, the average member of the S&P 500 has seen a -11% maximum drawdown from its YTD high. In addition, the S&P 500 has seen a -5% internal drawdown since the low of April 8, 2025, while the average member of the S&P 500 has seen a -22% internal drawdown.
NASDAQ: Strongest Rebound, Deepest Internal Volatility
YTD: -3% | +48% since 4/8/25 low | -6% max drawdown YTD | Avg. member: -23%
The NASDAQ has seen a -3% YTD decline, yet has rebounded strongly by 48% since the low of April 8, 2025. In addition, the NASDAQ has seen the strongest rebound of all the major indices. Yet, the NASDAQ has seen a -6% maximum YTD drawdown, while the average member of the NASDAQ has seen a -23% maximum YTD drawdown. In addition, the NASDAQ has seen a -8% internal drawdown since the low of April 8, 2025, while the average member of the NASDAQ has seen a -46% internal drawdown.
Russell 2000: Positive YTD, Elevated Member Volatility
+7% | +50% since 4/8/25 low | -5% max drawdown YTD | Avg. member: -16%
The Russell 2000 is the best performing major index year-to-date with a gain of +7%. It has also rallied 50% since the April 8 low. However, the average member of the index has experienced a maximum drawdown of -16% from the year-to-date high. Since the April low, the Russell 2000 has declined 9%, while the average stock has fallen 33%.
Dow Jones: Defensive Structure, Controlled Drawdowns
+3% | +32% since 4/8/25 low | -2% max drawdown YTD | Avg. member: -9%
The Dow Jones is also higher year-to-date with a gain of 3%. It has rallied 32% since the April 8 low. The Dow Jones has only experienced a maximum drawdown of 2% year-to-date. This is the smallest maximum drawdown of the major indices. Since the April low, the Dow Jones has fallen 6%, while the average member has fallen 17%.
As mentioned in the past several times, it is essential to note that while the indices have rallied significantly since the April lows, the average member of the indices has fallen significantly. This is a clear indication of the incomplete nature of the rally.
The Strongest Sector in All These Indices
Energy Leads 2026 with 19.7% YTD Gain, Dominating Sector Leadership
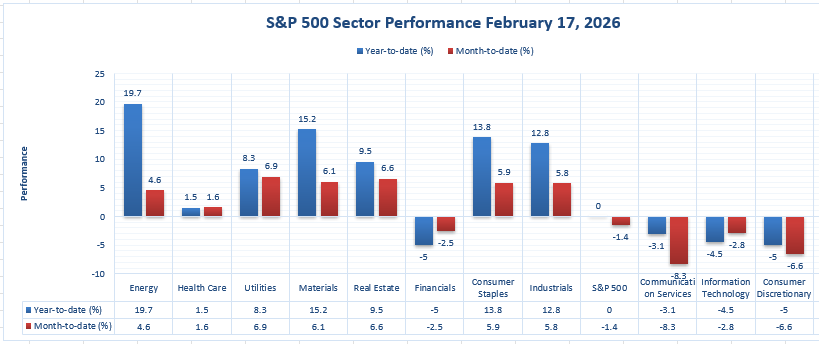
The Energy sector, as of the latest available data, remains clearly in the strongest position among all the sectors in the S&P 500, with a 19.7% year-to-date gain and a 4.6% month-to-date increase. No sector in this chart combines such a high level of year-to-date growth with a positive month-to-date increase. The S&P 500 Index, meanwhile, remains flat at 0.0% year-to-date and -1.4% month-to-date. The Energy sector is clearly in a position of leadership, and this leadership is structural.
The Energy sector is followed by the Materials sector, with a 15.2% year-to-date increase and a 6.1% month-to-date increase. The Consumer Staples sector comes in third with a 13.8% year-to-date increase and a 5.9% month-to-date increase. The Industrials sector comes in fourth with a 12.8% year-to-date increase and a 5.8% month-to-date increase. While these sectors are clearly performing well, they still trail behind Energy in terms of their year-to-date increases. The Energy sector remains clearly in first place with a 19.7% year-to-date increase.
We can see a wider disparity when compared to weaker sectors such as Financials, with a -5.0% year-to-date decrease and a -2.5% month-to-date decrease; Communication Services, with a -3.1% year-to-date decrease and a -8.3% month-to-date decrease; Information Technology, with a -4.5% year-to-date decrease and a -2.8% month-to-date decrease; and Consumer Discretionary, with a -5.0% year-to-date decrease and a -6.6% month-to-date decrease. The Energy sector clearly remains in a position of leadership in 2026, and this leadership is structural. We are also watching to see whether this leadership broadens to adjacent cyclical sectors or remains concentrated in Energy. As a general observation from our perspective at Zaye Capital Markets, a sector dominating this way typically determines the direction of the Index in subsequent quarters.
Earnings
Earnings – (Yesterday) 18-Feb-2026
- Booking Holdings Inc. (BKNG) posted Q4 revenue of $6.35B (up 16% YoY) and adjusted EBITDA of $2.2B (up 19% YoY) at a 34.6% margin, indicating significant operating leverage from increased travel activity. Gross travel bookings came in at $43.0B (up 16% YoY), and room nights grew to 285 million (up 9% YoY), indicating the increase was not only from pricing. Profitability also increased, with GAAP net income coming in at $1.42B to $1.43B (up ~34% YoY), GAAP EPS at $44.22 (up from $31.95), and adjusted EPS at $48.80 (up 17% YoY). Revenue for the full year 2025 was $26.9B (up 13%), adjusted EBITDA was $9.9B (up 20%), at a 36.9% margin, and net income was $5.4B. The recent announcement of a 25-for-1 stock split effective April 2026 is a positive indicator but should be viewed alongside the sustainability of booking growth and margins as travel comparisons become more difficult.
- Moody’s Corporation (MCO) posted Q4 revenue of $1.89B, alongside a GAAP net income of $610M, reflecting strong earnings conversion in a period where credit conditions and issuance activity matter. GAAP EPS was $3.41 (up 57% YoY), and adjusted EPS was $3.64 (up 39% YoY), indicating significant profit growth beyond revenue growth. Revenue for the full year 2025 was $7.72B (up 9% YoY), alongside a net income of $2.46B, GAAP EPS of $13.67 (up 21%), and adjusted EPS of $14.94 (up 20%). Analysts should look at the 2026 guidance, which reflects high single-digit revenue growth and adjusted EPS of $16.40 to $17.00.
- Analog Devices Inc. (ADI) disclosed its financial results for fiscal Q1 2026, where the company reported $3.16B in revenue (up 30% YoY) and exceptionally high profitability numbers that indicate strong pricing and mix advantages. The company reported a gross margin of $2.045B (64.7% GAAP) and operating income of $997 million (31.5% GAAP operating margin), while adjusted gross margin was $2.25B (71.2%) and adjusted operating income was $1.438B (45.5% operating margin). EPS came in at $1.69 (117% YoY) for GAAP EPS and $2.46 (51% YoY) for adjusted EPS. Cash flow generation remains a key pillar for the company: trailing twelve-month operating cash flow was $5.1B (43% of revenue) and free cash flow was $4.6B (39% of revenue). For fiscal Q2 2026, the company expects $3.5B in revenue (±$100M) and adjusted EPS of $2.88 (±$0.15), in addition to a 11% hike in the quarterly dividend to $1.10.
- Glencore plc announced full-year 2025 revenue of $247.535 billion, up 7% YoY, while profitability was lower than the previous year as its adjusted EBITDA was $13.511 billion, down 6% YoY, while its adjusted EBIT was $5.978 billion, down 14% YoY. Its net income attributable to equity holders was $363 million versus a loss of $1.634 billion in the prior year, while basic EPS was $0.03 versus a loss of $0.13 in the prior year. The internal trend is important as Glencore announced that in H2 2025, its adjusted EBITDA was $8.1B, up 49% from H1 2025. The capital return was also highlighted as Glencore proposed a total distribution of $2 billion while its net debt was approximately $11.17 billion. Analysts should be aware of the speed with which H2 improved to reach steadier full-year earnings power while keeping an eye on cash returns in the face of commodity price swings.
Earnings Preview — (Today) 19-Feb-2026
- Airbus SE earnings are out today, and the focus will be on execution, where the emphasis will be on execution in relation to deliveries, production rate credibility, and cash flow quality, given that aircraft production only makes sense if it eventually feeds into free cash flow and working capital management quality. We will see if guidance provides a stable ramp-up in capacity or if bottlenecks are back.
- Newmont Corporation earnings are out today, and the focus will be on a quality check in the gold cycle, where the most significant driver will be cost per ounce and execution quality, given that valuation support in mining stocks comes down to execution quality and not commodity price wins.
- Southern Company earnings are out today, and the focus will be on earnings stability and cash flow demands, where the most significant driver will be capital spending plans and their impact on cash flow confidence, given that utilities tend to trade on predictability and balance sheet quality and not growth stories.
- Nestle S.A. earnings are due today, and the big question will be whether growth is coming from volume or price. Key things to watch will include the trend in margins, cost pressure, and regional mix, as the leadership in consumer staples companies comes down to maintaining margins without sacrificing volume.
- Zurich Insurance Group earnings are due today, and the big question will be the quality of the underwriting results and the investment income performance. Key things to watch will include the trend in the combined ratio, reserve strength, and capital management, as the multiples compress quickly for insurers if the quality of the risk discipline is in question.
- Rio Tinto earnings are due today, and the big question will be production execution, cost control, and capital returns. Key things to watch will include the way in which iron ore and copper commentary relates to cost and capital, as in diversified mining companies, the difference between “strong prices” and “strong profits” is cost discipline
Stock Market Overview – Thursday, 19 Feb 2026
The US stock market is opening today with a cautious but constructive tone, as investors weigh the strength of economic reports against valuation sensitivity in large-cap tech stocks. Although the overall market is hovering near recent highs, underlying stock price movements and sector rotations are significant. At Zaye Capital Markets, we are watching the market leadership closely, as gains are uneven beneath the surface.
Stock Prices
Economic Indicators and Geopolitical Developments
Recent economic reports have continued to reinforce the theme of economic strength rather than a slowing market, which is making it difficult to gauge the timing of policy support. Meanwhile, AI infrastructure spending continues to be the major topic of discussion among the global investment community, particularly in the Asia-Pacific region. In other news, geopolitical events, including defense stocks and infrastructure investments between countries, are affecting tech stocks and industrials. Meanwhile, the stability in treasury yields is a key theme, as high yields continue to pressure high-multiple growth stocks.
Latest Stock News
- $NVDA is continuing to expand its presence in the global AI market. Yotta, a data center firm based in India, is building a $2B+ AI compute infrastructure using Nvidia Blackwell Ultra, as part of a $1B+ four-year DGX Cloud agreement. This is a significant expansion of Nvidia’s AI infrastructure platform beyond the US hyperscalers. In other news, Nvidia’s CEO said the new chips to be released at GTC 2026 will be unlike anything the company has ever released, indicating a continued pace in product development.
- $GOOGL is working to advance its “America–India Connect” project by developing new subsea fiber routes to connect India to the US and Southern Hemisphere countries. This is part of a $15B five-year commitment to advance AI infrastructure. Google also plans to roll out AI music generation in Gemini via DeepMind’s Lyria 3 model.
- $MSFT and $CRWD have extended their partnership by integrating Falcon into Azure Marketplace. This means that Falcon now qualifies for Azure spend commitments to further embed CrowdStrike into enterprise procurement workflows.
- $PANW may experience short-term headwinds from market expectations around integration risk from recent deals with Cyberark and Chronosphere. Nevertheless, as AI-driven machine identities multiply and the attack surface expands, cybersecurity budgets will continue to support Palo Alto’s long-term ambition to reach $20B in ARR by 2030.
- $META appears to be a significant player in the application layer for AI-driven monetization. AI-driven engagement and ad optimization have resulted in +18% impressions and +6% ad pricing. Yet the stock trades at 21x earnings.
- $PLTR was upgraded to Outperform from Outperform at $195 price target by a firm to reflect its position as a “Decision Layer Software Platform Connecting AI and Enterprise Data.” Despite multiple sensitivity in risk-off markets, category leadership remains a source of institutional conviction.
- $ONDS is in discussions to acquire Aeronautics, a drone manufacturer owned by Rafael that produces the Orbiter series of unmanned aircraft vehicles. The move is part of Ondas’ strategy to expand in Israel’s defense technology sector.
The “Magnificent Seven” and the S&P 500
The Magnificent Seven: Apple, Microsoft, Nvidia, Amazon, Meta Platforms, Alphabet, and Tesla, continue to be key drivers of the markets’ direction. The recent swings in the markets have been due to a re-pricing of valuations as opposed to any underlying structural issues in the economy. Nvidia and Microsoft are benefiting from the underlying strength in artificial intelligence infrastructure demand, while Meta Platforms’ acceleration in advertising is providing positive earnings momentum. However, the underlying stress in the group continues to be a negative factor in the S&P 500 Index due to their high weighting in the Index.
Major Index Performance as of Thursday, 19 Feb 2026
- Nasdaq Composite: The Index is trading around 22,700 levels, largely impacted by the movements in the mega-cap technology stocks and the underlying strength in the semiconductor sector.
- S&P 500: The Index is trading around 6,880 levels, largely impacted by the sector rotation into cyclicals and commodities.
- Russell 2000: The Index is trading around 2,650 levels, showing relative strength as capital flows into small-cap stocks.
- Dow Jones Industrial Average: The Index is trading around 49,600 levels, largely impacted by the underlying strength in industrial and energy sectors.
We continue to view the markets as selectively constructive as opposed to risk-on from an investment standpoint. The underlying variables that define our view are concentrated exposure to the mega-cap stocks, high valuations, and rate risk.
Gold Price: Is Gold Trading Near $4,980 to $5,000 an Ounce as Economic Data and Policy Risks Clash?
At present, spot gold futures are changing hands near the $4,980 to $5,000 an ounce level in today’s trading session. This indicates a consolidation near the psychologically important level of $5,000 an ounce. Recent presidential announcements have been dominated by domestic issues such as religious observances, education initiatives, tax-related issues, defense-related announcements, supply chain security announcements related to elemental phosphorus, and diplomatic engagements related to international commitments on rebuilding infrastructure. While these announcements have not had a direct impact on financial markets, a broad emphasis on national defense readiness, prioritization of strategic materials, and international stabilization efforts underscores a broad backdrop of geopolitical complexities. From a technical perspective, these issues have broad implications for medium-term safe-haven flows into gold. Today, a series of economic data announcements related to U.S. unemployment claims, the Philly Fed Manufacturing Index, and Pending Home Sales will have a broad influence on rate path probabilities. Stronger-than-expected readings in these key economic metrics have a tendency to bolster the U.S. dollar and lift U.S. real yields, creating a near-term headwind for non-yielding assets such as gold.
Yesterday’s economic data has provided the necessary catalyst for the consolidation phase. Robust industrial production and strong capital expenditures have alleviated recession risks while confirming the narrative of strong economic activity. This has minimized the need for swift policy actions, which has stabilized yields and checked the upside momentum in gold. While stability in economic data does not change the structural need for portfolio hedges, the stability in labor markets while maintaining active geopolitical positioning and persistent fiscal deficits has pushed the narrative of gold rallies to momentum-driven moves to strategic holding situations. Thus, the price action around $5,000 is a result of equilibrium between the resilience of economic activity and the uncertainty of policy actions. It is likely that the ecosystem for gold is determined by the ability of labor and housing market data to shift the probabilities of rate cuts or simply reinforce the narrative of steady economic growth.
Oil Prices: Will Geopolitical Tensions and Economic Data Push Oil Prices Higher?
Currently, the price of Brent crude is trading in the vicinity of the $69-per-barrel range, while the price of West Texas Intermediate (WTI) crude is trading in the vicinity of the $65-per-barrel range. Recent price swings in the energy market have been driven by renewed geopolitical tensions, including recent events in the Middle East and their impact on international diplomacy. The energy market is extremely sensitive to any perceived risk of disruptions, especially in relation to the defense posture of the United States. Recent messaging emanating from the White House, including the importance of national defense, the security of strategic materials, and international diplomacy, indirectly contributes to the price of crude oil, even in the absence of specific directives. At the same time, the price of oil is reacting to the overall demand situation in the global energy market, driven by the industrial pace and overall growth forecasts. International agencies are still calling for a measured increase in demand, which is tempering the upside in the price of crude oil.
The positive economic reports of the previous day, including strong industrial production and healthy capital spending data, have further fueled the narrative of strong energy demand in the short term. This is positive for crude oil prices. This is because strong economic reports reduce the likelihood of an impending recession. This is a major force that weighs on crude oil. Economic reports of the day to be released, including U.S. unemployment claims, Philly Fed Manufacturing Index, and Pending Home Sales, are crucial for crude oil direction. Positive reports of the day will have a positive impact on crude oil prices. This is because strong economic reports of the day will reinforce the narrative of strong energy demand. This is positive for crude oil. The crude oil ecosystem is influenced by the actions of the Organization of the Petroleum Exporting Countries. It is also influenced by the reports of international agencies. It is also influenced by geopolitical events.
Bitcoin Prices: Why Is Bitcoin Consolidating Near $67,000 Amid Macro Data and Policy Signals?
Bitcoin’s current price action is characterized by its consolidation in the $66,000 to $68,000 range, just above the crucial support zone of $65,000 and struggling to rise above the resistance in the low $70,000 mark. According to analysts, the order flow in the market indicates that despite the accumulation of the asset at lower prices, the overall market participation in the asset’s upside movement is still lacking. Currently, the regional pricing of the asset indicates that it’s priced at €79,000 in European markets, with minor fluctuations in the daily sessions in Latin American and Asian markets, indicating the global consistency in the consolidation trend in the asset’s price action. The overall crypto market, on the other hand, is seeing the rise of altcoins in the periodic sessions, indicating that the overall market participation in the digital asset space is not waning, and the asset is merely acting as a liquidity anchor in the market.
Current presidential commentary has focused on domestic institutional priorities, supply security, defense preparedness, and multilateral coordination efforts, rather than specific digital asset policy direction. Although the statements themselves don’t directly address the topic of cryptocurrency regulation, the policy focus on national security and fiscal issues can have an indirect impact on the overall risk sentiment, which in turn can impact digital assets. Yesterday’s strong economic data, including resilient industrial output and stable capital spending, helped to alleviate concerns regarding rate easing, causing real yields to rise and capping upside in cryptocurrencies. Bitcoin, like other non-yielding assets, tends to have a negative response to a decrease in the probability of rate cuts. Today’s unemployment claims, Philly Fed Manufacturing Index, and Pending Home Sales will be key data points to monitor, with weak numbers potentially rekindling rate easing hopes and fueling additional investment in risk assets, including Bitcoin, and stronger numbers potentially sustaining the consolidation, keeping BTC in a tight range as investors weigh the resilience of the macro backdrop against liquidity conditions.
ETH Prices: Is Ethereum Holding Near $2,000 as ETF Flows and Whale Moves Collide?
Currently, Ethereum is trading around the $1,970 to $2,020 price range. This range indicates that Ethereum is consolidating just below the crucial $2,100 price level. From a technical analysis point of view, Ethereum continues to hold up well at the crucial $1,800 price level. Over the last week or so, Ethereum has traded within a specific range. Recently, there have been some positive signs for Ethereum as the recently released spot Ethereum ETF data indicates renewed inflows into Ethereum. These inflows total around $13.8 million, which was recorded just this week. This indicates that Ethereum ETF inflows have not diminished at any point. This trend indicates that Ethereum continues to hold up well at the crucial $1,900 to $2,000 price range. Furthermore, blockchain data also indicates that Ethereum whales have accumulated around 840,000 ETH since early February when Ethereum was trading at lower price points.
However, the whale situation does not appear completely bullish, as indicated by reports that suggest at least one large whale has begun unwinding a 105,000 ETH leveraged position, selling around the $2,100 resistance area, effectively creating selling pressure around technical levels. This situation explains the repeated failure of Ethereum to sustain its rallies beyond $2,100, despite its buying momentum. Additionally, the macro environment has a significant impact on the overall situation, and yesterday’s strong economic data means that there will be no immediate need for monetary policy easing, which will stabilize the macro environment and prevent aggressive risk asset inflows. As a result, and given the fact that Ethereum reacts significantly to macro environments, a strong macro environment will compress the upside momentum, despite the presence of accumulation activity. Overall, the current environment appears well-balanced, with institutional inflows and whale accumulation providing support and selling pressure around the $2,100 level providing a degree of resistance.
