Where Are Markets Today?
Equity futures in Europe and the United States are signaling a lower start for the markets on Thursday, suggesting that the global markets could start the day on a cautious note after the strong gains that were registered in the previous session. The equity futures for the S&P 500 are showing a lower start of around 0.1% to 0.2%, while the Nasdaq equity futures are also showing a lower start. The Dow Jones equity futures are showing a decline of around 0.2% to 0.3%, suggesting that the Wall Street markets could start the day with some pressure. The European equity markets are also showing a cautious start with the STOXX Europe 600 equity futures showing a lower start. The markets have started the day with caution after the strong gains that were registered in the technology and semiconductor stocks in the previous session, which helped the markets surge higher.
One of the key factors that has led to a conservative market sentiment in futures markets is the changing geopolitical environment related to the ongoing conflict between Iran and its neighbors. The fear of a major disruption in global energy flows has somewhat dissipated, given that there are reports that naval escorts might be provided for oil tankers passing through the Strait of Hormuz, which is considered to be one of the world’s most important oil shipping channels, responsible for providing around 20% of the world’s total oil output. The prices of oil have stabilized, and there has been a rise in prices earlier in the week, which has somewhat eased the pressure on the markets. However, investors are still cognizant of the fact that a minor disruption in energy flows can lead to inflationary pressure, impact corporate performance, and alter global economic expectations.
Trade policy developments are another key reason that has led to a conservative market sentiment in futures markets, given that there are reports that a new global tariff policy of around 15% is likely to be introduced in the near term, which has led to a fear that there might be a negative impact on international trade flows and corporate performance in general. The imposition of tariffs is known to impact corporations, leading to higher costs for consumers and a negative impact on inflation and corporate profitability in general. At the same time, there are reports that the era of low interest rates that led to a positive market performance in the past decade is slowly coming to an end, and investors might demand higher premiums for equities, especially in sectors that were impacted the most by the positive market sentiments and the high liquidity environment in the markets.
Finally, investors are being cautious before some key catalysts that are due to be announced today. Weekly jobless claims figures are likely to reveal important information regarding the health of the labor market, which is one of the key statistics to gauge the health of the economy in general. In addition to that, quarterly earnings announcements by some key retailers like Kroger and Costco are likely to reveal important information regarding consumer spending habits at a time when inflation, geopolitical risks, and trade policies are affecting investors’ sentiments. All these factors are likely to determine whether the positive trend in global stocks would be sustainable or whether investors would again be exposed to volatility due to geopolitical risks, trade policies, and other changes in the economy.
Major Index Performance as of Thursday, 5 Mar 2026
- Nasdaq Composite: Trading near 23,420, as technology stocks experience valuation adjustments following strong gains earlier in the year.
- S&P 500: Trading around 6,880, reflecting mixed sector performance as strength in energy and industrial companies offsets weakness in parts of the technology sector.
- Russell 2000: Trading near 2,540, showing moderate resilience as investors rotate toward domestically focused companies.
- Dow Jones Industrial Average: Trading around 49,000, supported by strength in industrial and energy-related companies.
The Magnificent Seven and the S&P 500
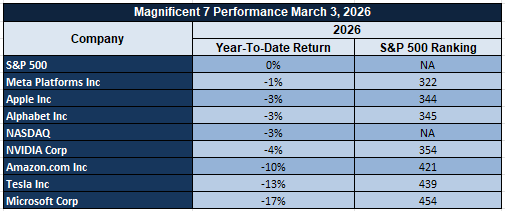
The so-called “Magnificent Seven” — Apple, Microsoft, Nvidia, Amazon, Meta, Alphabet, and Tesla — remain under pressure as investors reassess valuation levels following an extended period of strong gains. These companies collectively carry significant weight within the S&P 500, meaning weakness in their share prices can disproportionately impact the broader index. Rising interest-rate expectations and profit-taking in high-growth technology stocks have contributed to recent volatility, with investors rotating toward sectors such as energy and industrials. At Zaye Capital Markets, we view this dynamic as evidence that concentrated leadership among mega-cap technology firms can amplify market swings when sentiment shifts.
Drivers Behind the Market Move – Thursday, March 5, 2026
As the markets in the US and Europe prepare to open on Thursday, market sentiment is being influenced by a variety of factors, including geopolitical events, energy markets, and the release of economic indicators. Although the markets in the US posted significant gains in the last session, led by the performance of tech stocks and semiconductor companies, the futures markets are signaling a cautious tone today. Geopolitical events, the Middle East conflict, energy markets, and the impact of the release of economic indicators on the global economy also remain significant factors in the markets today.
- Middle East Conflict and Energy Market Risks
The Middle East conflict remains one of the biggest factors influencing the markets today. It has been confirmed that the operation targeted Iranian missile sites as part of the larger military operation to weaken the strategic position of the country in the region. The administration also issued a statement that the US Navy could escort ships passing through the Strait of Hormuz, one of the most important shipping lanes in the world that accounts for 20 percent of the world’s daily oil consumption. The statement helped to calm the markets somewhat in the last session of the week, allowing the price of oil to stabilize after the sharp jump in the last session. However, the markets remain cautious as the Middle East conflict has the potential to impact the global economy by causing disruptions in the energy markets, which could lead to higher inflation in the US economy as well as impacting the bottom line of companies in the US.
2. Energy Policy Developments and Technology Infrastructure Expansion
Another significant factor that is currently influencing markets can be attributed to the recent announcements of new policies that aim to create a relationship between the expansion of energy infrastructure and artificial intelligence computing capacity. The government has invited key technology players such as Amazon, Google, Meta, Microsoft, OpenAI, Oracle, and xAI for the initiative, which aims to protect electricity consumers while supporting the increasing demand for artificial intelligence computing capacity. The technology players, as part of the Ratepayer Protection Pledge, have agreed to support the funding of new grid infrastructure and electricity capacity for artificial intelligence computing capacity. The developments also noted that oil supply is increasing from Venezuela, which can be attributed to efforts aimed at stabilizing oil markets amidst geopolitical tensions.
3. Key Economic Data and Monetary Policy Expectations
Markets are also focusing on other important economic data releases that may have implications for monetary policy and growth prospects. Weekly unemployment claims figures due today will offer a “live” update on labor market health, which has been one of the key contributors to consumer spending and overall economy growth. If claims rise above forecasts, it may indicate weakening economy growth and reinforce bets that policymakers may take a dovish stance towards interest rates. On the other hand, if labor markets look healthy, it may reinforce bets that economy growth remains robust and therefore sustain high interest rates for longer periods. In addition to this, comments by European Central Bank President Draghi are also being keenly observed by investors to gauge inflation trends and subsequently interest rate directions in Europe. All these important economic indicators are prompting investors to take a watchful stance before making any conclusions regarding whether or not to sustain the latest rally in global stocks.
In summary, the global markets today are impacted by various geopolitical, energy, and upcoming economic data points, which could have an impact on monetary policy expectations. While corporate earnings and technology sector strength have been positives for the markets, investors are still keeping a close eye on the macro environment and how these factors could impact the markets in the near term.
Digesting Economic Data
The TRUMP Tweets and Its Implications
As of March 4, 2026, the latest tweets and announcements made by the current administration on global market trends and movements indicate three major areas that are currently impacting global market movements. These include geopolitical tensions, energy security, and infrastructure development related to artificial intelligence. The most market-moving announcements made by the current administration include the escalation of military strikes on Iran under Operation Epic Fury, with thousands of targets struck and a confirmation of weakening Iran’s missile and military potential. Additionally, there has been an announcement on evacuation efforts across the Middle East and a confirmation that the naval forces are geared and ready to escort commercial vessels across the Strait of Hormuz, one of the most critical global energy routes. This waterway alone carries 20% of global oil supply, and any movements or tensions on this route are likely to impact global oil prices and subsequently global market movements. Generally, market-moving announcements on military strength and security on routes such as these are likely to have a double impact on market movements, with riskier assets facing a potential short-term impact and gold and oil prices moving favorably as investors seek to secure their assets.
Another important set of comments centered around energy diplomacy and global oil supply issues. The president noted that oil supplies out of Venezuela were increasing and expressed appreciation for cooperation with Venezuelan officials in energy production. These comments can be viewed as an effort to offset supply risks emanating out of the Middle East conflict by encouraging additional crude supplies out of other regions. In other words, these comments are designed to calm energy markets at a time when military conflict in the region has already caused sharp swings in crude oil prices and concerns over inflation and growth. As it relates to investors, it should be noted that energy supplies are likely to be volatile but may not be structurally constrained if additional sources emerge.
The third set of comments made by the administration centered around technology infrastructure and electricity supplies in relation to artificial intelligence expansion. The administration confirmed that major technology firms including Amazon, Google, Meta Platforms, Microsoft, Open AI, Oracle, and xAI have agreed to participate in a Ratepayer Protection Pledge to finance infrastructure necessary to build new data centers to house artificial intelligence technology. In other words, technology firms have agreed to pay for the cost of electricity to build data centers to house artificial intelligence technology and to coordinate with other firms to build backup capacity to support data centers. As it relates to financial markets, it should be noted that investors should be aware that the rapid expansion in artificial intelligence technology has now begun to impact energy policy in the US and has begun to have structural implications for technology infrastructure and other industries including semiconductors, cloud computing, and data-center construction.
Lastly, the overall tone of the comments appears to be a balance of military strength and economic commentary aimed at bolstering stability domestically, while projecting strength externally. The administration has been vocal about increasing defense spending, continued pressure on Iran, and long-term investments in workforce training and infrastructure, particularly in relation to energy and technology development. On one hand, the diplomatic efforts, including peace and unity during cultural celebrations, appear to be an attempt to strike a balance between geopolitical tensions and overall political outreach. The macro environment, from a financial standpoint, appears to be one of increasing complexity, where geopolitical risks, energy security, and technology investments have become more interconnected. Investors should be paying close attention to these developments, as movements in military activities, energy policies, and large-scale infrastructure investments have the potential to impact commodities, equities, and digital assets.
Services Sector Expansion Signals Strong Demand Before Energy Market Shock 
The February ISM Services Purchasing Managers’ Index advanced to 56.1, exceeding market expectations of 53.5 and marking the strongest reading since July 2022. The report highlights broad strength across the services economy, with new orders rising sharply to 58.6 while employment indicators also moved higher. Such readings signal strong business activity across sectors including logistics, hospitality, financial services, and technology-related services. From our perspective at Zaye Capital Markets, this type of expansion above the 55 threshold typically reflects strong demand conditions across consumer and corporate service industries. The data suggests that service providers were experiencing healthy order flows and operational momentum, indicating a supportive environment for revenue growth across companies tied to consumer spending and enterprise services.
However, the timing of the survey is important for interpreting the data accurately. The February reading reflects economic conditions before the disruption in global energy markets triggered by the closure of a critical oil transit route in the Middle East on February 28, 2026. That development halted a significant portion of global crude shipments and immediately introduced a new supply shock into energy markets. Because energy costs influence transportation, logistics, hospitality, and many service industries, the economic conditions reflected in the survey do not yet capture the potential cost pressures that may emerge in the coming months. Even though the prices-paid component of the survey eased to 52.3, historical economic research suggests that disruptions in Middle Eastern energy flows have often translated into rising service-sector costs within a short period of time.
Given these dynamics, we believe that Uber Technologies Inc. (UBER) appears undervalued relative to its exposure to structural growth in mobility and digital service platforms. As a company operating at the intersection of transportation, logistics, and consumer services, Uber stands to benefit from continued demand in the services economy, particularly if consumer activity remains resilient. Analysts should closely monitor fuel cost trends, consumer spending data, and mobility demand indicators across major urban centers. If services activity remains strong while companies adapt to higher energy costs through pricing and efficiency strategies, digital platform companies with flexible cost structures may continue to deliver stronger-than-expected revenue performance in the evolving services landscape.
Manufacturing Payroll Decline Highlights Automation Shift in Industrial Sector 
The latest private payroll data for February 2026 reveals a continued divergence within the labor market, particularly in the manufacturing sector. The report shows a decline of 5,000 jobs in manufacturing payrolls, marking another month without net employment growth since March 2024. This persistent weakness contrasts with broader labor market resilience, as the private sector overall added 63,000 jobs during the same period. Job growth was largely driven by gains in construction and health services, sectors that continue to benefit from infrastructure spending and demographic demand. From our perspective at Zaye Capital Markets, the data signals an important structural transition within industrial activity where output expansion is no longer tightly linked to employment growth.
A closer examination of Industrial data supports this structural interpretation. While manufacturing payrolls have stagnated, production levels across many factories have continued to expand due to rising investment in automation technologies, robotics, and digital manufacturing systems. Industrial output in several subsectors has increased despite declining labor intensity, highlighting how modern factories are prioritizing efficiency and precision over workforce expansion. In fact, manufacturing output has reportedly increased by roughly 2.4% year over year even as payroll figures declined, reinforcing the view that productivity improvements are driving the next phase of industrial competitiveness. This dynamic explains why some analysts view the job losses not as a cyclical slowdown but as evidence of a structural shift toward highly automated manufacturing environments.
Given these developments, we believe Rockwell Automation Inc. (ROK) appears undervalued relative to the long-term industrial automation cycle. As a major provider of industrial control systems, robotics integration, and smart factory software solutions, the company is well positioned to benefit from the continued transition toward automated production systems. Businesses facing labor shortages and rising wage costs increasingly invest in automation infrastructure to sustain production growth while controlling operational expenses. Analysts should closely monitor capital expenditure trends among manufacturers, factory equipment orders, and industrial productivity indicators to determine whether automation investment continues accelerating. If productivity gains remain strong despite employment softness, automation technology providers may see sustained demand growth across multiple manufacturing industries.
Dollar Rally Signals Global Risk Aversion and Capital Flight to Safety 
Currency markets experienced a sharp shift on March 2, 2026 as the U.S. dollar strengthened broadly against major global currencies. Market data showed declines ranging from approximately 0.51% against the Canadian dollar to nearly 1.65% against the Swedish krona, highlighting a widespread move into dollar-denominated assets. From our perspective at Zaye Capital Markets, such synchronized currency movements typically occur when investors seek safety and liquidity during periods of geopolitical uncertainty. The dollar remains the dominant global reserve currency and often attracts capital flows when investors move away from risk-sensitive assets such as emerging market currencies, global equities, and certain commodities.
The surge In dollar demand coincided with heightened geopolitical tensions across the Middle East during the same period, which triggered a strong risk-off reaction across global markets. Energy prices rose sharply as crude oil surged more than five percent amid concerns about potential supply disruptions in key shipping routes. Higher oil prices combined with geopolitical uncertainty placed pressure on global equity markets, particularly companies exposed to international trade and transportation costs. Historically, episodes of geopolitical escalation have often strengthened the dollar as investors reduce risk exposure and increase holdings of highly liquid financial assets tied to the world’s largest economy.
Given these conditions, we believe Chevron Corporation (CVX) appears undervalued relative to the evolving energy market dynamics. As a large integrated energy producer with diversified upstream and downstream operations, the company stands to benefit from sustained strength in crude oil prices driven by geopolitical supply concerns. Higher oil prices typically translate into stronger operating cash flows for major energy producers with stable production capacity. Analysts should closely monitor global crude inventory levels, tanker traffic through key energy transit routes, and movements in the dollar index to determine whether the current risk-off environment persists. If geopolitical tensions continue influencing energy markets and currency flows, energy majors with strong balance sheets and global production assets could see renewed investor interest.
Rising Trucking Rates Signal Freight Recovery and Strengthening Goods Demand 
Recent freight market data indicates a noticeable rise in spot trucking rates, with the Midwest region recording some of the steepest increases. Rates climbed to approximately $2.91 per mile as of late February 2026, reflecting stronger freight demand and tightening transportation capacity. Trucking prices are widely regarded as an early economic indicator because they capture real-time activity across supply chains tied to manufacturing, retail, agriculture, and industrial distribution. From our perspective at Zaye Capital Markets, the rise in freight pricing suggests that businesses are gradually rebuilding inventories and shipping volumes are improving after the prolonged freight downturn experienced between 2023 and 2025. As shipping demand strengthens, it often signals broader improvement in goods movement across the economy.
The Increase in freight rates also aligns with broader signs of stabilization in consumer spending and logistics activity. Retailers and manufacturers appear to be replenishing inventories following periods of cautious stocking strategies during earlier economic uncertainty. When inventory rebuilding begins, transportation networks typically experience stronger demand for trucking services, which quickly drives spot freight prices higher. At the same time, the recovery remains uneven and sensitive to policy developments. Trade policy uncertainty, including potential tariffs affecting global supply chains, continues to introduce volatility into freight markets. These policy shifts can influence import volumes, shipping routes, and trucking demand across key industrial regions.
Given these developments, we believe Knight-Swift Transportation Holdings Inc. (KNX) appears undervalued relative to the improving freight cycle. As one of the largest trucking and logistics providers in North America, the company benefits directly from rising shipping demand and improving freight pricing conditions. When spot trucking rates increase, large carriers with efficient fleet management and diversified logistics services tend to experience stronger revenue visibility and operating leverage. Analysts should closely monitor freight volume indicators, inventory restocking trends, and retail shipment data to determine whether the freight recovery continues gaining momentum. If trucking rates remain elevated while freight demand expands across industrial and consumer sectors, transportation companies with large-scale logistics networks may see meaningful earnings improvement.
Strait of Hormuz Oil Dependence Raises Global Energy Security Concerns 
Recent energy flow data highlights the strategic importance of the Strait of Hormuz for global oil supply chains, particularly for Asian economies that rely heavily on shipments passing through the narrow maritime corridor. Data tracking crude oil flows between 2020 and 2025 shows that China alone imports more than 25 million barrels per day through routes connected to the strait, far exceeding other large importers such as India, which receives roughly 5 million barrels per day through similar channels. From our perspective at Zaye Capital Markets, this concentration of supply risk underscores the vulnerability of global energy markets to disruptions in key shipping chokepoints. When such routes face instability, energy traders typically react quickly, repricing crude oil futures to reflect the possibility of supply interruptions.
The significance of this dependency became even more visible during recent geopolitical tensions in early March 2026 that temporarily halted shipping activity and raised concerns about potential closure of the strait. Because a large share of global oil exports passes through this corridor, even short-term disruptions can trigger immediate volatility across commodity markets. Crude oil prices often respond sharply to such developments as traders anticipate tightening supply conditions. However, longer-term impacts may be moderated by global energy diversification strategies. Large importing economies have gradually expanded alternative supply channels, including pipeline infrastructure and strategic petroleum reserves, which can help cushion temporary shocks if maritime disruptions are resolved quickly.
Given these dynamics, we believe Exxon Mobil Corporation (XOM) appears undervalued relative to its exposure to global energy supply cycles. As one of the world’s largest integrated energy producers with upstream assets across multiple regions, the company is positioned to benefit from periods of elevated oil prices driven by geopolitical supply concerns. Higher crude prices generally strengthen revenue generation for companies with established production capacity and global distribution networks. Analysts should closely monitor tanker traffic through major energy transit routes, global crude inventory levels, and strategic reserve policies among major importing economies. If geopolitical tensions continue influencing oil supply expectations, integrated energy companies with diversified production portfolios may see improved profitability as energy markets adjust to supply uncertainty.
Upcoming Economic Events
Unemployment Claims, ECB President Lagarde Speaks
As global markets navigate a complex mix of geopolitical tensions, currency volatility, and shifting growth expectations, investors are turning their attention to two important economic developments today: the weekly unemployment claims data and remarks from the European Central Bank leadership. These events serve as real-time signals for labor market health and monetary policy direction, both of which have direct implications for equities, currencies, and interest rate expectations. At Zaye Capital Markets, we believe these indicators provide valuable insight into whether economic momentum is stabilizing or beginning to weaken as financial markets attempt to balance growth optimism with rising global uncertainty. Here is how each event could influence investor sentiment and market direction.
Unemployment Claims
Weekly unemployment claims remain one of the most closely watched high-frequency indicators for assessing labor market strength.
- If the actual claims figure comes in lower than the forecast, it would signal that layoffs remain limited and that businesses continue to retain workers despite economic uncertainty. A stronger labor market generally supports consumer spending because stable employment strengthens household income and confidence. In this scenario, equity markets—particularly consumer discretionary and retail sectors—may respond positively as investors interpret the data as evidence of continued economic resilience. However, stronger employment data could also reinforce expectations that central banks may maintain tighter monetary policy for longer in order to prevent inflation from accelerating, which could place upward pressure on bond yields.
- On the other hand, if unemployment claims rise above the forecast level, markets may interpret the data as an early signal that hiring momentum is weakening. A sustained increase in claims can indicate that companies are beginning to reduce workforce levels as demand slows or cost pressures rise. Such an outcome could increase investor concerns about slowing economic growth and push capital toward defensive sectors such as healthcare and utilities. At the same time, higher claims could encourage expectations that monetary policy may eventually become more supportive if economic conditions deteriorate. Analysts should closely monitor the trend in continuing claims and labor participation indicators to determine whether rising claims represent temporary volatility or the beginning of a broader labor market slowdown.
ECB President Lagarde Speaks
Remarks from the European Central Bank leadership often carry significant influence across global financial markets because policy signals from the eurozone’s central bank can affect currency flows, bond yields, and investor confidence.
- If the speech emphasizes the need to maintain tight monetary policy to control inflation, the euro could strengthen while European bond yields may rise as markets price in a prolonged period of restrictive policy. Such messaging could also create pressure on global equity markets if investors interpret it as a sign that borrowing costs will remain elevated. Financial institutions and banking stocks could benefit in this environment due to higher interest rate margins.
- Conversely, if the tone of the speech suggests that inflation pressures are easing and that policymakers may begin shifting toward a more supportive stance, risk assets may react positively. Equity markets in Europe and globally could see renewed investor interest as lower borrowing costs improve corporate financing conditions and stimulate economic activity. Currency markets would likely respond as well, with the euro potentially weakening if investors anticipate future rate reductions. Analysts should pay close attention to language around inflation persistence, economic growth expectations, and financial stability concerns, as these themes often signal the future direction of monetary policy.
Stock Market Performance
Indexes Recover from 2025 Lows but Market Breadth Remains Uneven
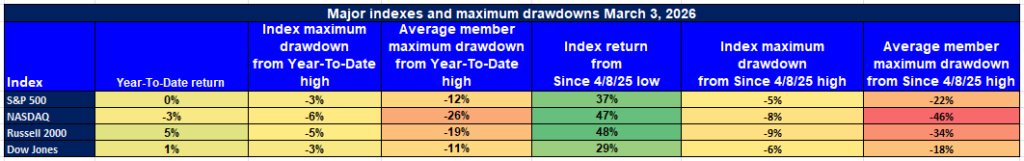
Equity markets have delivered strong rebounds since the April 8, 2025 market trough, but underlying participation across individual stocks remains uneven. While major indexes have recovered significantly from last year’s lows, year-to-date performance shows that markets are still navigating volatility and uneven leadership. From our perspective at Zaye Capital Markets, the divergence between headline index performance and the deeper drawdowns experienced by the average index constituent highlights the importance of examining market breadth rather than relying solely on index-level gains.
Below is our breakdown of performance across major equity benchmarks based strictly on the latest figures available.
S&P 500: Headline Stability Masks Broader Weakness
YTD: 0% | +37% since April 8, 2025 low | -3% from YTD high | Avg. member: -12%
The S&P 500 currently sits flat year-to-date, reflecting a market that has largely stabilized but has not yet generated meaningful upside momentum in 2026. Despite this, the index has surged 37% from its April 8, 2025 low, demonstrating strong recovery from last year’s market stress. However, the average member of the index remains down 12% from its year-to-date high, revealing that gains are still concentrated among a smaller group of large-cap leaders rather than broadly distributed across the market.
NASDAQ: Strong Recovery but Deep Internal Drawdowns
YTD: -3% | +47% since April 8, 2025 low | -6% from YTD high | Avg. member: -26%
The NASDAQ has delivered the strongest rebound from the 2025 lows, rising 47% since April 8, yet the index remains down 3% year-to-date. This divergence reflects the volatility often seen in technology-heavy growth sectors. More importantly, the average NASDAQ member remains down 26% from its year-to-date high, indicating that many technology and growth companies have experienced far deeper corrections than the index headline suggests.
Russell 2000: Small-Cap Strength but Still Fragile
YTD: +5% | +48% since April 8, 2025 low | -5% from YTD high | Avg. member: -19%
The Russell 2000 has delivered a notable rebound of 48% since its April 2025 trough and currently leads major indexes with a 5% year-to-date gain. This reflects renewed investor interest in smaller companies tied to domestic economic activity. However, the average member remains down 19% from its year-to-date high, suggesting that the small-cap recovery is still uneven and sensitive to economic growth expectations and financing conditions.
Dow Jones: Defensive Index Shows Relative Stability
YTD: +1% | +29% since April 8, 2025 low | -3% from YTD high | Avg. member: -11%
The Dow Jones Industrial Average has shown comparatively steady performance, rising 1% year-to-date and 29% from the April 2025 low. Its defensive composition, which includes large multinational companies with stable earnings profiles, has helped cushion volatility. Even so, the average member remains down 11% from its year-to-date high, reinforcing the theme that broader participation across individual stocks still trails headline index performance.
At Zaye Capital Markets, we view this divergence between index recovery and member drawdowns as a reminder that market leadership remains narrow. Investors should closely monitor breadth indicators, sector rotation patterns, and earnings resilience across companies to determine whether the current recovery evolves into a more durable and widely supported market expansion.
The Strongest Sector In All These Indices
Energy Leads by a Wide Margin, While Most Sectors Slip Month-to-Date
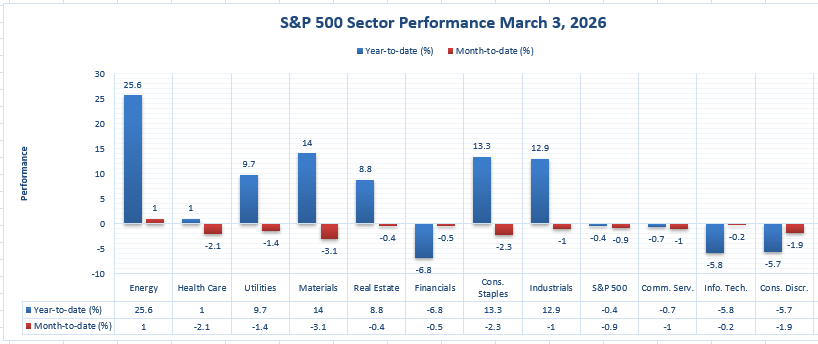
Based strictly on the sector performance figures, Energy is the clear leader. It is up 25.6% year-to-date and also positive 1.0% month-to-date, making it the strongest sector on both time horizons shown. This stands out because most other sectors are either down month-to-date or delivering far smaller year-to-date gains. From our perspective at Zaye Capital Markets, the key takeaway is that leadership is concentrated, and the market’s strongest pocket is being driven by a single sector rather than broad-based participation.
What reinforces this point is the second layer of the chart: even sectors with solid year-to-date gains are currently losing ground on the month. Materials is up 14.0% year-to-date but down -3.1% month-to-date. Consumer Staples is up 13.3% year-to-date but down -2.3% month-to-date. Industrials is up 12.9% year-to-date but down -1.0% month-to-date. Utilities is up 9.7% year-to-date but down -1.4% month-to-date. Real Estate is up 8.8% year-to-date but down -0.4% month-to-date. Even Health Care is only up 1.0% year-to-date and down -2.1% month-to-date. This pattern signals rotation and profit-taking rather than a clean, broad rally.
The broader index backdrop confirms the narrow leadership. The overall benchmark is down -0.4% year-to-date and down -0.9% month-to-date, while several growth-linked areas remain notably weak: Financials are down -6.8% year-to-date (and -0.5% month-to-date), Information Technology is down -5.8% year-to-date (and -0.2% month-to-date), and Consumer Discretionary is down -5.7% year-to-date (and -1.9% month-to-date). We view this as a market that is still leaning on Energy strength to offset weakness elsewhere. Analysts should watch whether Energy remains positive month-to-date while the rest of the market stabilizes, because if Energy leadership fades without recovery in the lagging sectors, index-level performance can deteriorate quickly.
Earnings
Yesterday’s Earnings – March 4, 2026
Several major companies released earnings on March 4, offering investors insight into key global sectors including semiconductors, banking, sportswear, and digital platforms. At Zaye Capital Markets, we view these results as important indicators of structural trends ranging from artificial intelligence infrastructure spending to global consumer demand and digital business expansion.
- Broadcom Inc. (AVGO) – Broadcom reported results for its first quarter of fiscal year 2026 (ended February 1, 2026), delivering record performance driven largely by demand tied to artificial intelligence infrastructure. The company posted revenue of $19,311 million, representing a 29% increase from $14,916 million in the same period last year. GAAP net income reached $7,349 million, while non-GAAP net income came in at $10,185 million. Adjusted EBITDA totaled $13,128 million, equivalent to 68% of revenue and up 30% year-over-year. GAAP diluted earnings per share stood at $1.50, while non-GAAP diluted EPS reached $2.05. The company highlighted strong growth in AI semiconductor demand as a key contributor to the record consolidated revenue of roughly $19.3 billion. From our perspective at Zaye Capital Markets, the key factor for analysts to monitor is whether hyperscale data center investment continues sustaining semiconductor demand at this pace, as AI infrastructure spending remains one of the strongest drivers of the semiconductor cycle.
- Metro Bank Holdings Plc (MTRO) – Metro Bank reported results for the full year ended December 31, 2025, showing a notable turnaround in profitability. The bank recorded pre-tax profit of £87.2 million compared with a loss of £212.1 million in 2024. Underlying profit reached £98.1 million, representing the highest level in the company’s history and a sharp improvement from the £14.0 million loss reported in the previous year. Net interest income rose to £460.3 million, up 22% from £377.9 million, while revenue increased to approximately £585 million, representing more than £81 million in annual growth. Gross loans and advances to commercial customers expanded to £3,939 million, up 19%. Earnings were reported at £52.4 million, with earnings per share around £0.077 under some GAAP references. Investors should focus on the sustainability of the bank’s net interest margin, which exited the year at 3.17%, as well as the trajectory of loan growth in the commercial lending segment.
- Adidas AG (ADS) – adidas reported its full-year 2025 and fourth-quarter results, highlighting a strong recovery in brand momentum and global sales growth. For the full year, revenue reached €24.8 billion, representing a record topline for the company, while operating profit rose to €2,056 million, an increase of 54%. Operating margin improved to 8.3%, up 2.6 percentage points, while gross margin increased to 51.6%. In the fourth quarter of 2025, revenue totaled approximately €6.1 billion, with operating profit of €164 million compared with €57 million in the same quarter the year before. Operating margin improved to 2.7%. Management highlighted double-digit growth across all markets and channels for the year and guided toward high single-digit revenue growth for 2026 with operating profit projected around €2.3 billion. For analysts, the key focus will be how sustained brand demand and product momentum translate into margin expansion and global market share gains in the competitive sportswear sector.
- Wix.com Ltd. (WIX) – Wix reported strong fourth-quarter 2025 results, reflecting continued expansion in digital website and online commerce services. Revenue reached $524 million for the quarter, representing approximately 14% year-over-year growth. Bookings totaled $535 million, increasing 15% year-over-year. Non-GAAP diluted earnings per share came in at $1.81, exceeding market expectations, which were estimated around $1.42 to $1.45. The company highlighted strong momentum from new user cohorts and strong performance from Base44, which reached approximately $100 million in annual recurring revenue. From our perspective at Zaye Capital Markets, Wix remains a strong indicator of global digital business formation trends, as rising demand for online platforms reflects continued growth in small business digital infrastructure and e-commerce adoption.
Today’s Earnings Preview – March 5, 2026
Several companies are scheduled to report earnings today, offering investors insight into sectors including healthcare, grocery retail, energy production, and wholesale retail distribution. At Zaye Capital Markets, we believe these results will provide an important read on consumer demand, pharmaceutical innovation, and commodity-linked earnings performance.
- Merck KGaA (MRK) – Investors will closely examine pharmaceutical revenue growth, research pipeline updates, and drug development progress. The company’s healthcare and life science divisions remain key contributors to long-term earnings expansion. Analysts should watch updates on pharmaceutical research pipelines, regulatory approvals, and demand for specialty medicines, as these elements often determine the sustainability of earnings growth across global healthcare companies.
- Kroger Co. (KR) – Kroger’s earnings will provide a crucial view of consumer behavior within the grocery retail sector. Investors should focus on same-store sales growth, pricing power, and private-label product performance, as grocery retailers often experience shifts in consumer purchasing patterns during periods of economic uncertainty. Analysts should also monitor inventory management and cost pressures across supply chains, as grocery margins can be influenced heavily by food price volatility and transportation costs.
- Petroleo Brasileiro SA Sponsored ADR (PBR) – Petrobras results will be closely watched by energy investors as the company’s performance often reflects broader global oil market dynamics. Analysts should examine crude production levels, capital expenditure plans, and dividend policy, particularly as geopolitical developments and supply disruptions influence oil price expectations. Petrobras’ operational efficiency and cash flow generation remain key indicators for investors evaluating the sustainability of returns in the energy sector.
- Costco Wholesale Corporation (COST) – Costco’s earnings will serve as an important gauge of middle-income consumer spending trends. Analysts should focus on membership growth, renewal rates, warehouse trafficq and average sales per warehouse location. Investors will also watch how effectively the company manages supplier costs and maintains pricing stability. Costco’s membership model and strong customer loyalty often provide a reliable signal for broader retail demand and household consumption patterns.
Stock Market Overview – Thursday, 5 Mar 2026
U.S. equity markets opened with a cautious tone as investors continue to weigh geopolitical tensions, rising energy prices, and mixed economic signals. Recent developments around global shipping routes and oil supply risks have pushed crude prices higher, while investors are also digesting fresh labor market data and a wave of corporate earnings reports. At Zaye Capital Markets, we observe that markets remain highly sensitive to macro headlines and interest-rate expectations, which is limiting risk appetite even as corporate earnings remain broadly resilient.
Stock Prices
Economic Indicators and Geopolitical Developments
Investor sentiment remains fragile following renewed geopolitical developments that have raised concerns about energy supply chains and shipping disruptions. Rising crude prices are introducing fresh inflation concerns, which could complicate the outlook for monetary policy. Meanwhile, recent labor market data suggests hiring momentum is slowing but still stable, reinforcing the view that economic growth is moderating rather than collapsing. Markets are therefore navigating a delicate balance between slowing economic indicators and persistent inflation pressures. In this environment, investors are increasingly rotating across sectors rather than chasing a broad market rally.
Latest Stock News
- $NVDA | Nvidia’s leadership highlighted that artificial intelligence computing demand is increasingly tied to global economic expansion. As companies deploy AI infrastructure and digital workforces, compute power demand is expected to grow alongside global GDP. This reinforces Nvidia’s central role in the AI ecosystem as cloud providers and enterprises expand data center capacity.
- $AVGO | Broadcom’s long-term transformation continues to attract investor attention. Five years ago the company generated roughly $25B in revenue with about $5B in profit. Today Broadcom produces roughly $68B in revenue and approximately $28B in profit. The company now generates more in gross profit than it produced in total revenue five years ago, highlighting the impact of its semiconductor and infrastructure software expansion.
- $RGTI | Rigetti Computing has drawn attention across the technology sector after reporting roughly $1.9M in quarterly revenue while carrying a market valuation near $6B. For perspective, Alphabet generated roughly $17M in profit per hour during the same period. The comparison underscores the speculative nature of early-stage quantum computing investments relative to established technology giants.
- $HOOD | Robinhood introduced a premium Platinum Card made from actual platinum, offering higher credit limits, airport lounge access, and travel benefits. The card carries a $695 annual fee and includes incentives such as 5% cash back on dining and flights, 10% on hotels, and roughly $800 in travel-related credits along with memberships tied to digital health and wearable technology platforms.
- $TTD | The Trade Desk drew investor attention after its chief executive purchased approximately $148M worth of company shares, marking the largest insider purchase in the company’s history and the first insider buying activity in nearly four years. The company has also reportedly explored discussions about helping automate and scale advertising within conversational artificial intelligence platforms, which could significantly expand digital advertising revenue opportunities.
- $ADS | adidas shares are gaining attention after reporting strong revenue and operating profit growth, reflecting improving global demand for athletic apparel and footwear. Investors are watching how sustained brand momentum translates into margin expansion in 2026.
- $WIX | Wix.com delivered strong quarterly results driven by growth in digital platform subscriptions and online commerce services. Analysts view the company as a proxy for small-business digital adoption trends across global markets.
The Magnificent Seven and the S&P 500

The so-called “Magnificent Seven” — Apple, Microsoft, Nvidia, Amazon, Meta, Alphabet, and Tesla — remain under pressure as investors reassess valuation levels following an extended period of strong gains. These companies collectively carry significant weight within the S&P 500, meaning weakness in their share prices can disproportionately impact the broader index. Rising interest-rate expectations and profit-taking in high-growth technology stocks have contributed to recent volatility, with investors rotating toward sectors such as energy and industrials. At Zaye Capital Markets, we view this dynamic as evidence that concentrated leadership among mega-cap technology firms can amplify market swings when sentiment shifts.
Major Index Performance as of Thursday, 5 Mar 2026
- Nasdaq Composite: Trading near 23,420, as technology stocks experience valuation adjustments following strong gains earlier in the year.
- S&P 500: Trading around 6,880, reflecting mixed sector performance as strength in energy and industrial companies offsets weakness in parts of the technology sector.
- Russell 2000: Trading near 2,540, showing moderate resilience as investors rotate toward domestically focused companies.
- Dow Jones Industrial Average: Trading around 49,000, supported by strength in industrial and energy-related companies.
At Zaye Capital Markets, we continue to view the current environment as a selective market phase where sector rotation, earnings visibility, and macro developments will determine leadership. Investors should closely monitor energy prices, interest-rate expectations, and technology-sector earnings momentum, as these factors are likely to shape equity performance in the weeks ahead.
Gold Price: What Drives Gold Prices Higher During Geopolitical Tensions and Data Shocks?
Spot gold is currently trading near $5,016 per ounce, holding close to record territory as global investors continue repositioning toward defensive assets amid intensifying geopolitical developments and energy-market uncertainty. The latest sequence of policy and security announcements has heightened focus on the Middle East, particularly the Strait of Hormuz, a maritime route responsible for roughly one-fifth of global oil flows. Military operations targeting regional missile infrastructure, large-scale evacuations, and commitments to escort energy shipments through the corridor have elevated geopolitical risk perceptions across financial markets. In parallel, government announcements suggesting that oil supply is beginning to flow again from Venezuela introduce a complex narrative for energy markets, where potential supply stabilization competes with ongoing conflict risk. When geopolitical developments coincide with volatility in global energy supply expectations, gold historically attracts capital inflows as investors hedge against sudden disruptions in commodities, currencies, and equity markets. At the same time, policy coordination with major technology firms to secure electricity supply for expanding artificial-intelligence infrastructure signals rising structural demand for energy and power capacity, indirectly reinforcing inflation sensitivity across the global economy—another factor that often supports gold as a long-term store of value.
Economic signals released yesterday and key data scheduled for today further shape the market environment influencing gold. Recent labor market indicators revealed modest job creation combined with signs of slowing hiring momentum, a combination that reduces the probability of aggressively restrictive monetary policy while maintaining uncertainty around the global growth outlook. Today’s weekly unemployment claims data will provide a more immediate gauge of labor market stability, while remarks from the European Central Bank leadership may clarify how policymakers are assessing inflation persistence and economic momentum in major economies. If unemployment claims rise above expectations or policymakers emphasize growth risks, investors typically rotate further into safe-haven assets such as gold, as weaker economic conditions tend to compress real yields and increase demand for defensive portfolio allocation. Conversely, stronger labor data could temporarily strengthen the dollar and apply short-term pressure to bullion prices, although persistent geopolitical uncertainty and energy-market volatility may continue providing underlying support. In this environment—where geopolitical tensions intersect with uncertain macroeconomic signals—gold remains positioned within global portfolios as a hedge against financial instability, inflation risk, and currency volatility.
Bitcoin Prices: Why Is Bitcoin Trading Near $73,000 as Institutional Demand Returns?
Bitcoin is currently trading near $72,824, according to the latest TradingView market data, as of March 5, 2026. The price has stabilized in the $73,000–$73,400 range following a strong rebound from the latest sell-off that saw the price drop to the mid-$60,000 levels. The price has been boosted by renewed institutional demand in the digital asset space, with spot exchange-traded funds that track Bitcoin prices now having seen more than $458 million in net inflows, indicating renewed interest in Bitcoin from institutional investors and asset managers. At the same time, the overall cryptocurrency market capitalization has risen to $2.5 trillion, indicating renewed interest in the overall crypto space and crypto-related equities and assets. Other factors that are contributing to the overall market narrative are the tensions in the Middle East, where military operations are taking place in response to missile threats, and the overall security situation in the **Strait of Hormuz, where 20 percent of the world’s oil passes through**. The administration has been taking a number of policy actions related to large technology companies and the overall electricity infrastructure, where companies such as Amazon, Google, Meta, Microsoft, OpenAI, Oracle, and xAI agreed to invest in the overall electricity infrastructure in the United States in exchange for the ability to build artificial intelligence infrastructure in the country. The overall growth in digital computing demand is a positive indicator for Bitcoin and the overall digital space, given its indirect impact on the overall blockchain space and digital assets in general.
The same can be said for the role that macroeconomic data plays in determining the price of Bitcoin. Yesterday’s economic data releases revealed that the overall economic activity was moderate with signs of weakening in the labor market. This supports the idea that the overall financial conditions may not tighten as quickly as expected. In an economic scenario where interest rate pressures are stabilized, the price of Bitcoin is likely to rise as an asset class that offers better growth prospects for risk-taking investors. In today’s economic data releases, the upcoming economic data releases include weekly unemployment claims data, as well as the European Central Bank president’s comments. These data releases have the ability to influence the expectations of the global economy’s monetary policies. In the event that the unemployment claims rise above the expected figures, this could mean that the overall economic momentum is slowing down. This could weaken the dollar, thereby increasing the demand for Bitcoin. However, the analysts have again pointed out that the key support for Bitcoin is at $70,000. Market participants have pointed out that the price stability above this price could mean that the breakout is complete. In the coming days, the price of Bitcoin is likely to rise as the overall ecosystem of Bitcoin reacts favorably to the changes in the global liquidity scenario.
ETH Prices: Why Is Ethereum Price Moving as ETF Inflows and Whale Activity Surge?
Ethereum is currently trading near $2,150, stabilizing above the important $2,100 support zone after recovering from the broader cryptocurrency market correction seen earlier in February. The second-largest cryptocurrency has been attempting to rebuild upward momentum as institutional flows begin to return to the market. One of the most notable developments over the past week has been renewed accumulation by large institutional players through exchange-traded fund exposure. Recent reports indicate that BlackRock acquired roughly $41.9 million worth of Ethereum, reinforcing the narrative that large asset managers continue to view Ethereum as a strategic digital asset alongside Bitcoin. In parallel, spot Ethereum ETFs have begun to record fresh inflows, including approximately $26.47 million entering BlackRock’s iShares Ethereum Trust, suggesting that institutional capital is gradually returning to Ethereum markets following earlier volatility. These flows are particularly important because ETF inflows often absorb circulating supply and can create a stabilizing effect on price during periods of uncertainty. Beyond institutional flows, network activity across the Ethereum ecosystem remains strong. On-chain data over the past week has shown rising daily active addresses, increased smart-contract interactions, and stronger decentralized-finance participation, signaling that demand for Ethereum’s blockchain infrastructure remains structurally healthy. From a market-structure perspective, analysts are closely watching the $2,100–$2,170 range, which represents a critical technical zone that could determine whether Ethereum continues its recovery toward higher levels such as $2,300 and beyond or enters a period of consolidation as investors reassess risk conditions across the broader crypto market.
At the same time, whale activity is playing a major role in shaping Ethereum’s short-term price volatility, as large holders continue to influence liquidity across trading venues. Over the past week, on-chain monitoring services have reported several high-value transactions involving large Ethereum wallets. One particularly notable event involved a leveraged trader holding a substantial short position that was liquidated for approximately $30 million after Ethereum surged more than 5 percent, highlighting how rapid price movements can trigger liquidation cascades that temporarily accelerate upward momentum. However, whale activity has not been entirely one-sided. Blockchain tracking platforms also recorded a transfer of roughly 82,000 ETH—valued at more than $164 million—to major exchanges, suggesting that some large holders may be positioning to rebalance portfolios or take profits following the recent rebound. These movements demonstrate how Ethereum’s ecosystem is strongly influenced by the behavior of large capital holders whose transactions can quickly shift market liquidity. The interaction between institutional ETF inflows, whale wallet movements, and broader macroeconomic sentiment is therefore shaping Ethereum’s near-term outlook. If ETF inflows continue to strengthen and whale accumulation outweighs distribution, Ethereum could build the foundation for a more sustained recovery. Conversely, if large holders continue moving significant volumes to exchanges, short-term volatility could persist even as long-term institutional adoption gradually expands. For investors tracking Ethereum’s next move, monitoring ETF capital flows, whale transaction patterns, and blockchain activity metrics will remain essential for understanding how the digital asset’s price structure evolves in the coming weeks.
