Where Are Markets Today?
European and US equity index futures are trading flat to slightly positive this morning, stabilizing after Thursday’s technology-driven sell-off on Wall Street. Equity index futures for the S&P 500 and Nasdaq are trading slightly higher, with Dow Jones futures trading flat. European index futures are mirroring this sentiment, suggesting a pause in market momentum rather than a shift to renewed bullishness. Global equity markets are trading this way for two key reasons: first, investors are processing the significant valuation reset for mega-cap technology stocks driven by artificial intelligence; and second, markets are waiting for the January Consumer Price Index report, which will show a year-over-year gain of 2.5% and a monthly gain of 0.3%.
Thursday’s sell-off in US stocks revealed growing concerns that the recent artificial intelligence bubble will experience a normalization rather than an implosion. Yesterday, the S&P 500 fell by nearly 1.6%, the Nasdaq dropped by approximately 2%, and the Dow Jones plummeted by approximately 670 points. Technology stocks were hit hard, with Apple falling by 5% and Cisco falling by 12% on lower-than-expected guidance. However, the fact that index levels remain close to historic highs indicates that markets are merely recalibrating growth expectations rather than experiencing a fundamental shift. European index futures are trading similarly, with export-sensitive and technology-sensitive stocks vulnerable to shifts in global demand expectations and rate-sensitive capital flows.
Inflation has become the driving force. The latest inflation figures are due for release today, which will have a direct impact on interest rate expectations, bond yields, currency strength, and stock market multiples on either side of the Atlantic. If inflation is higher than anticipated, the market may respond favorably to a higher-for-longer rate scenario, impacting growth stocks and strengthening the dollar. Conversely, if inflation is softer than anticipated, risk appetite may improve, benefiting stock market multiples and possibly leading to short-covering activity in technology stocks.
From a Zaye Capital Markets perspective, the neutral positioning of global futures is seen as a consolidatory phase of a still-fragile risk environment. Despite the steady underlying index contracts, sector spreads are still high, and the dominance of mega-cap technology stocks continues to drive volatility. The next significant directional move may depend on inflation confirmation and earnings sustainability. In the meantime, selectivity and risk management are essential.
Major Index Performance as of Friday, 13 Feb 2026 (latest available pricing)
- Nasdaq Composite: 22,597.15, down 2.04%
- S&P 500: 6,832.75, down 1.57%
- Russell 2000: 2,612.19, down 2.15%
- Dow Jones Industrial Average: 49,451.88, down 1.34%
The Magnificent Seven and the S&P 500

The Magnificent Seven, which includes Apple, Microsoft, Nvidia, Amazon, Meta, Alphabet, and Tesla, continue to play a vital role in determining market direction. Their pullback is still weighing on both the S&P 500 and the Nasdaq Composite. The concentration risk is still elevated, and skepticism regarding capital intensity and AI monetization timelines has seen an increase in volatility across the entire tech sector.
Drivers Behind the Market Move – Friday, 13 February 2026
European and U.S. markets are trading cautiously today. The price action is a result of a delicate balance between macroeconomic fundamentals and factors affecting interest rate direction. Three factors are driving the market sentiment based on the latest developments up to yesterday and today.
1. Inflation Data Risk Repricing
The major market mover is the U.S. Core CPI m/m, CPI m/m, and CPI y/y data that will be released today. The futures have been stable overnight, with traders taking a cautious stance before the inflation data is released. The market is highly sensitive to inflation data following the positive U.S. employment data that reduced rate cut prospects earlier in the week. A higher-than-expected inflation reading is likely to reinforce the “higher for longer” interest rate scenario, causing Treasury yields to rise and impacting U.S. and European equities, especially rate-sensitive growth stocks. European markets are highly sensitive to the inflation scenario given their exposure to U.S. dollar strength.
2. Regulatory Shock and Energy Policy Recalibration
The administration’s move to rescind the 2009 “endangerment finding,” or the basis for federal climate change regulations, is causing regulatory uncertainty in the industrial, energy, and utility sectors. The market is trying to process the ramifications of what many regulatory analysts have called the most aggressive deregulatory action yet. The action is intended to ease industry and consumer costs, but it also may lead to protracted legal battles or policy reversals at the state or judicial levels.
3. Geopolitical and Trade Signaling
Diplomatic efforts surrounding the potential Iran deal, selective engagement with U.N. organizations, and apparent delays in implementing certain China-related tech restrictions have impacted global market risk. The market is interpreting these moves as reduced risks of immediate escalation in global conflict, particularly in the Middle East regarding energy supplies. The tension between Fed rate cut rhetoric and deficit projections, combined with renewed Middle East positioning, has contributed to volatility in recent sessions. The European markets are particularly sensitive to these issues due to trade dynamics and their high dependence on foreign energy supplies.
At Zaye Capital Markets, we want to confirm that these issues are specific market-moving factors related to recent events, specifically within the last 24-48 hours. The CPI release is the current market-moving factor, while the issues discussed above are medium-term market risk influencers.
Digesting Economic Data
The TRUMP Tweets and Their Implications
President’s latest regulatory actions, particularly the repeal of the 2009 EPA “endangerment finding,” represent the most significant shift in U.S. climate policy in decades. On February 12, 2026, the Environmental Protection Agency formally revoked the scientific and legal basis that greenhouse gases endanger public health and welfare — a cornerstone that had enabled broad federal climate regulations under the Clean Air Act. By dismantling this foundation, vehicle emissions limits, power plant standards, and other greenhouse gas controls are effectively nullified, creating a high-stakes legal and regulatory battle ahead. The reversal has been framed domestically as deregulatory relief for industry and consumers and a reduction in compliance costs, but it has drawn widespread criticism from environmental and scientific communities who warn that removing this scientific finding weakens long-term environmental protections and could increase litigation risk for businesses operating under uncertain regulatory expectations.
Beyond climate policy, the President’s diplomatic and trade communications — including signals of engagement with Iran nuclear talks, revised China-related technology restrictions tied to trade strategy, and joint statements on frameworks such as trade cooperation with North Macedonia — contribute to broader risk sentiment in financial markets. These messages interact with macro policy narratives, including tensions between rate-cut rhetoric and fiscal projections, introducing uncertainty for capital markets pricing and risk asset allocations. As investors digest mixed signals from regulatory rollback and geopolitical positioning, confidence in long-term policy stability has been challenged, contributing to volatility across commodities, equity, and digital asset sectors. Key geopolitical developments, such as support for stabilization efforts in Gaza and the administration’s approach to global institutions, also shape broader risk perceptions that can influence cross-asset correlations and hedging demand.
The cumulative implications are multi-layered: for energy markets, deregulation signals potentially higher near-term production and lower compliance costs may cap oil and gas prices but weigh on renewable energy investment demand. For equities, regulatory uncertainty and shifting trade diplomacy can recalibrate sectoral leadership and risk premiums, particularly in industrials, energy, and environmentally sensitive sectors. For fixed income and currency markets, the interplay between fiscal narratives and regulatory shifts influences yield curves and dollar strength, which in turn affects risk asset pricing dynamics. Legal challenges to the climate rollback are expected to persist, adding another layer of policy uncertainty that markets must price in, while state and local regulatory responses may partially offset federal rollbacks.
At Zaye Capital Markets, we view the cumulative narrative as heightening policy drag on investor certainty. Regulatory reversals of this scale disrupt long-standing expectations about environmental and industrial frameworks, and — when combined with diplomatic positioning and macro signals — contribute to cross-asset volatility that demands careful risk management. Investors should monitor litigation trajectories, sector exposure to regulatory shifts, and evolving fiscal narratives as core inputs into portfolio positioning amid this transitional policy environment.
Jobless Claims Tick Higher as Labor Market Remains Controlled in Cooling Cycle
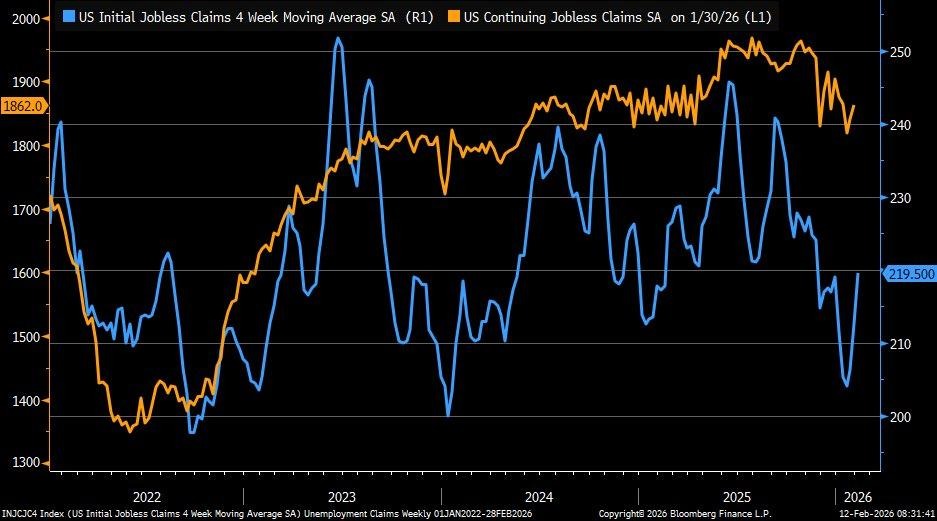
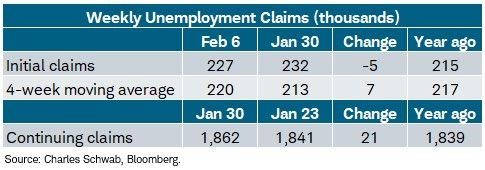
Initial jobless claims increased to 227,000 for the week ending February 6, marginally higher than consensus and yet lower than the last reading. This further confirms our thesis that the labor market is structurally firm despite incremental cooling. The four-week moving average rose to 230,000 and yet appears to be relatively stable year over year. This indicates no systemic deterioration in employment trends. At Zaye Capital Markets, we see this as a normalization of the labor market and not a weakening. Jobless claims remain close to historic lows, indicating that layoffs remain controlled despite slowing hiring trends. This balance minimizes the odds of any drastic policy changes while maintaining steady wage growth and consumption resilience.
Continuing jobless claims rose to 1.862 million, marginally higher than consensus and rising week over week. This indicates that the unemployed are taking a little longer to get back to work. Regional increases in Pennsylvania, New York, and Missouri may reflect manufacturing adjustments and seasonal recalibrations. Analysts should monitor these trends and assess whether they reflect systemic weakening in the employment environment. Analysts should also monitor labor force participation, wage growth metrics, and payroll growth in the service sector to gauge whether these trends persist or remain steady.
Given the steady employment trends and controlled layoff risk, we see Walmart Inc. (WMT) as undervalued and yet maintaining a defensive model for earnings growth. A steady labor market provides household spending stability, particularly in value-oriented retail environments where traffic remains strong despite rising income disparities. Analysts should monitor comparable sales growth, inventory turnover, and wage cost management to gauge margin durability in a moderating yet steady labor environment.
Average Weekly Hours Stabilize, Signaling Balanced Labor Demand
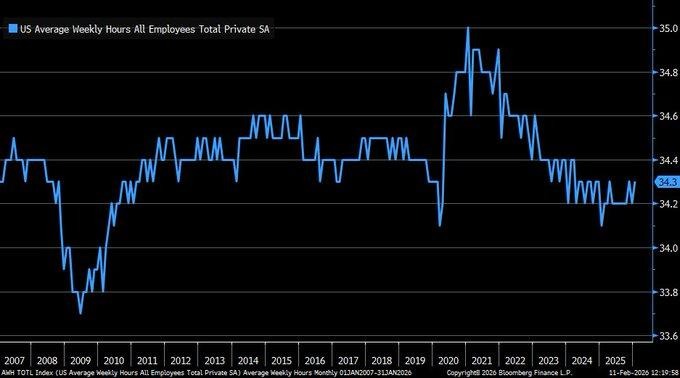
The average hours worked during the week increased to 34.3 in January, as the incremental stabilization continues within the narrow range established since the disruption. This represents a modest improvement but still lags the pre-2020 levels of 34.4 to 34.5. We view this as an indication of balanced labor demand rather than an expansionary acceleration in labor hours. We see employers as being cautious in increasing hours despite stable payroll trends. This view is reinforced by the narrow range of 34.2 to 34.3 established over the recent quarterly trends. This further supports our view of balanced labor demand, which is strong enough to prevent labor contraction but not so strong as to generate wage inflationary pressures. This sustained range also indicates employers are optimizing existing workforce capacities before adding to the workforce. This balanced demand may eventually alleviate wage pressures while maintaining stable income for consumers. More importantly, the stable hour trends reduce inflationary concerns related to labor intensity, which is critical for businesses with labor-intensive cost structures. However, the inability to break above the pre-2020 levels also indicates structural shifts in labor trends and workforce hours. We recommend close monitoring of productivity trends, service sector payroll trends, and hourly earnings trends to gauge the expansion in hours as an early indicator of an acceleration in economic growth. Under this backdrop of stable labor trends and balanced wage pressures, we view Home Depot Inc. (HD) as an undervalued play on earnings sensitivity to stable household income trends. Stable hour trends ensure consistent disposable income trends, which in turn support home improvement trends without pressuring labor-intensive cost structures. We recommend close monitoring of comparable store sales trends, contractor demand trends, and housing turnover trends to validate sustained revenue traction.
Foreign-Born Workforce Growth Reshapes U.S. Labor Dynamics
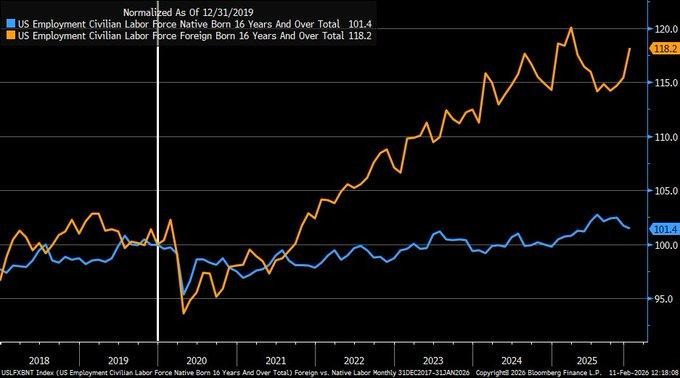
The foreign-born workforce has recorded a growth of 18.2% between late 2019 and early 2026, compared to the native-born workforce growth of 1.4% during the same period. This is due to differences in the underlying population dynamics. The foreign-born workforce has surpassed 19% of the total workforce, recording a substantial rise compared to the pre-2020 period. At Zaye Capital Markets, we believe this change is a permanent shift, not a cyclical fluctuation. Without the growth of the foreign-born workforce, the total workforce growth would have been substantially limited.
The impact of this change is substantial. The foreign-born workforce has filled the gap in the construction, healthcare, logistics, and hospitality industries, which have maintained steady growth despite the underlying headwinds. Without this growth, the acceleration of wages, which has been a major concern, has been tempered. The growth of the foreign-born workforce has also maintained the development capacity of the housing industry. Without this growth, the impact of the 4.4 million native-born workforce retirees entering the workforce each year would have had a substantial impact on the total workforce supply.
Based on this analysis, we believe Caterpillar Inc. (CAT) is undervalued due to its exposure to the infrastructure and construction industries. The foreign-born workforce growth has a substantial impact on the total workforce supply. A strong workforce growth rate in the construction industry has a substantial impact on the equipment demand for Caterpillar. Analysts should review Caterpillar’s order books, dealer inventory, and non-residential construction spending to validate equipment demand due to workforce growth.
Unemployment Duration Remains Elevated Despite Payroll Gains
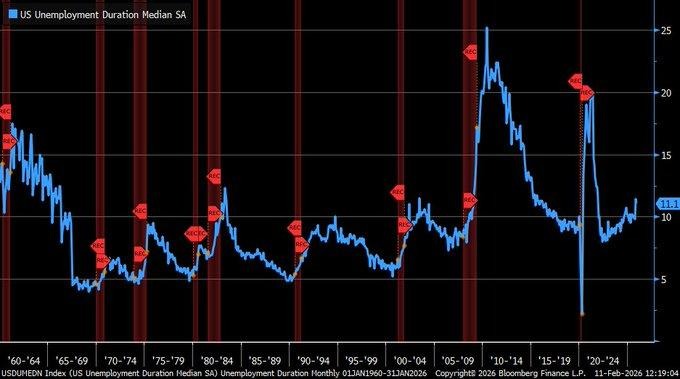
In the January employment report, a small but significant divergence was observed. The addition of 130,000 jobs and a lower unemployment rate of 4.3% were accompanied by a median unemployment duration of 11.1 weeks, a small decrease from the December figure of 11.4 weeks but a noticeable increase from the low of 9.8 weeks observed in the latter half of 2025. At Zaye Capital Markets, we believe the elevated unemployment duration is indicative of underlying labor market issues. The historical trend of elevated unemployment duration during economic downturns is understandable; however, the current situation represents a structural issue rather than a cyclical downturn. The hiring environment is strong, but the speed of re-employment is slow.
Elevated unemployment duration implies a longer period of job search for workers who were displaced from the workforce. This phenomenon is often accompanied by moderating wage acceleration. Analysts should pay close attention to average hourly earnings, labor force participation, and hiring dispersion within industries. The moderating unemployment duration will likely temper inflationary expectations but should not be seen as a sign of underlying labor market issues. The overall labor market picture is a mixed bag, and within this environment, we believe Accenture plc (ACN) is undervalued and worth attention from analysts. The company’s exposure to corporate workforce restructuring and spending on digital transformation initiatives makes it a prime beneficiary of the prolonged unemployment duration. The phenomenon of elevated unemployment duration is often accompanied by increased spending on efficiency consulting and automation initiatives. Analysts should pay close attention to corporate spending on IT and corporate initiatives aimed at workforce restructuring and digitization.
Upcoming Economic Events
Core CPI m/m, CPI m/m, CPI y/y
As we approach the release of the latest inflation data, markets are entering a high-impact macro window where positioning across equities, bonds, currencies, and commodities could recalibrate quickly. Inflation remains the primary driver of interest rate expectations, and interest rate expectations remain the backbone of asset valuation. Core CPI month-over-month, headline CPI month-over-month, and CPI year-over-year will collectively determine whether the current disinflation narrative holds or begins to stall. At Zaye Capital Markets, we believe this release carries outsized importance because it directly influences bond yields, equity multiples, liquidity conditions, and forward earnings assumptions across sectors.
Core CPI m/m and CPI m/m
- If Core CPI and headline CPI print above consensus, markets are likely to interpret this as renewed underlying price pressure, particularly in services and housing-linked components. In this scenario, Treasury yields would likely move higher as traders reprice the probability of delayed rate cuts or extended restrictive policy. Higher yields typically compress equity valuations, especially in long-duration growth stocks where future earnings are more sensitive to discount rate shifts. Defensive sectors may outperform, while cyclical sectors could face near-term volatility. The dollar would likely strengthen on relative yield support, and volatility measures could spike as positioning adjusts.
- If, however, both measures come in below expectations, it would reinforce the cooling inflation thesis. Bond yields would likely decline, easing financial conditions and supporting equity valuations. Growth stocks could benefit from multiple expansion, while cyclical sectors tied to domestic demand may rally on improved confidence. A softer inflation print would also weaken the dollar, potentially supporting commodities and emerging market assets. In short, downside inflation surprises would restore risk appetite and reduce near-term policy uncertainty.
CPI y/y
The annual CPI reading provides trend confirmation and broader context.
- A higher-than-forecast year-over-year figure would challenge the sustainability of the disinflation trajectory, potentially triggering a more defensive market tone. Rate-sensitive sectors such as real estate, utilities, and consumer discretionary would likely experience pressure as borrowing cost expectations rise. Financials could initially benefit from steeper yield expectations, but broader equity sentiment may weaken if policy tightening fears resurface.
- Conversely, a lower-than-expected annual CPI reading would strengthen confidence that inflation is moving steadily toward target levels. This would compress yields across the curve, improve credit spreads, and support broad-based equity gains. Analysts should closely monitor Treasury market reactions, sector rotation, inflation expectations pricing, and forward guidance revisions during earnings season to determine whether this release marks a continuation of stability or a shift in the macro narrative.
Stock Market Performance
Indexes Have Recovered from Lows of April, But Internal Drawdowns Reveal Fragility of Stocks
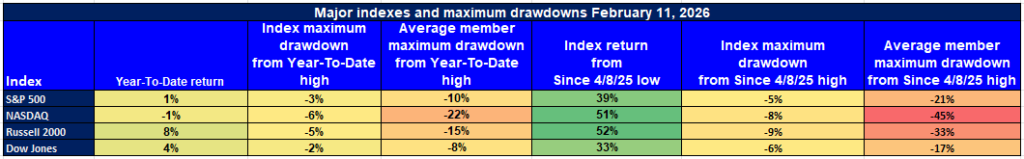
U.S. equity markets are up significantly since their low on April 8, 2025, but year-to-date stock performance has been uneven, and internal drawdowns continue to highlight the fragility of stocks. Despite strong performance in major indexes, average stock performance reveals that only a few stocks are driving these indexes, and volatility is still prevalent in the market. At Zaye Capital Markets, we believe that despite the strong performance of indexes, stocks are still vulnerable.
S&P 500: Stable Headline, Moderate Internal Stress
YTD: +1% | +39% since 4/8/25 low | -3% from YTD high | Avg. member: -10% YTD | -21% since 4/8/25 low
S&P 500 stocks are up modestly by +1% YTD, reflecting steady performance in large-cap stocks. S&P 500 stocks experienced only a -3% maximum drawdown from YTD highs, indicating stability in these stocks. Since their low on April 8, 2025, S&P 500 stocks are up by +39%. However, average stocks are only up by -10% from YTD highs and -21% since their low on April 8, 2025.
NASDAQ: Strong Rebound, Deep Member Volatility
YTD: -1% | +51% since 4/8/25 low | -6% from YTD high | Avg. member: -22% YTD | -45% since 4/8/25 low
The NASDAQ has rebounded substantially, rising 51% from the April lows. However, it is still down 1% year to date. The recent 6% pullback from YTD highs seems to be manageable on the surface; yet, the average member’s 22% YTD and 45% from the April lows indicate the ongoing weakness within growth stocks.
Russell 2000: Small-Cap Strength with Uneven Depth
YTD: +8% | +52% since 4/8/25 low | -5% from YTD high | Avg. member: -15% YTD | -33% since 4/8/25 low
The Russell 2000 is the strongest year to date at +8%. The recent rally is 52% from the April lows. However, the average member’s 15% YTD and 33% from the April lows indicate the ongoing volatility within small-cap stocks.
Dow Jones: Defensive Resilience Holds
YTD: +4% | +33% since 4/8/25 low | -2% from YTD high | Avg. member: -8% YTD | -17% since 4/8/25 low
The Dow Jones is 4% year to date and 33% from the April lows. The recent 2% pullback from YTD highs is relatively minor. The average member’s 8% YTD and 17% from the April lows indicate the relatively stronger stability within defensive and value-based sectors.
At Zaye Capital Markets, we remain selective and look to individual stocks on a balance sheet and earnings basis, while considering breadth confirmation. The disparity between the indexes and the average member’s performance is a reminder of the importance of a selective investment strategy.
The Strongest Sector in All These Indices
Energy Dominates 2026 Performance with Clear Leadership Across Timeframes
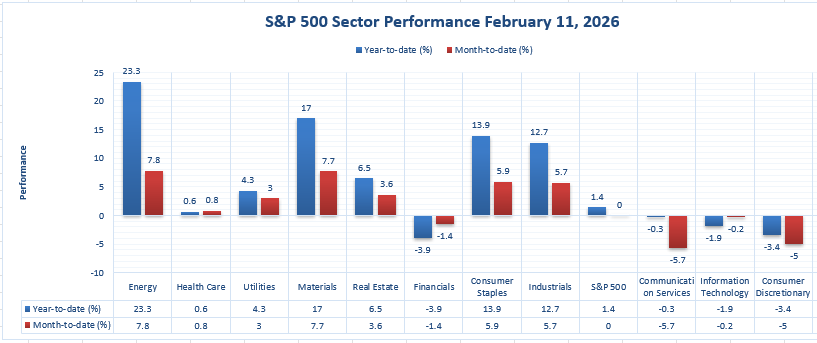
According to the latest data available, the Energy sector is the strongest sector within the S&P 500 Index, having shown leadership over the year-to-date and month-to-date periods. The sector is up +23.3% year to date and +7.8% month to date, making it the strongest sector within the S&P 500 over these two critical periods. In a market environment where sector dispersion is quite wide, these results confirm that the Energy sector is not only the strongest sector over a longer period of time, but it is also showing leadership over a shorter period of time.
The magnitude of the Energy sector’s leadership is quite impressive. The next strongest sector year to date is Materials at +17.0%, followed by Consumer Staples at +13.9%, and Industrials at +12.7%. Real Estate is a distant fourth at +6.5%, which is a fraction of the +23.3% gain of the Energy sector year to date. In the month to date, Materials is second at +7.7%, Consumer Staples at +5.9%, and Industrials at +5.7%, all of which are below the +7.8% gain of the Energy sector. In contrast, there are a number of sectors that have shown weakness year to date, including Financials at -3.9%, Consumer Discretionary at -3.4%, Information Technology at -1.9%, and Communication Services at -0.3%.
From our perspective at Zaye Capital Markets, these results reinforce our view of sector rotation and not a general expansion of the equity market. The contrast between the +23.3% year to date gain of the Energy sector and the +1.4% gain of the S&P 500 Index underscores the point that sector leadership is a dominant feature of the market’s performance. The question analysts need to consider is whether the sector leadership will broaden to other sectors or remain concentrated within a few sectors. The narrower the leadership group, the more sensitive the market is to sector rotations.
Earnings
Yesterday’s Earnings Recap, February 12, 2026
- Anheuser-Busch InBev SA/NV – Full Year results for FY2025: Revenue of $59,320 million USD (+2.0% organic), Normalized EBITDA of $21,223 million USD (+4.9%), Underlying profit of $7,410 million USD, and Reported profit attributable to equity holders of $6,837 million USD. Underlying EPS of $3.73 USD (+6.0% YoY). Organic EBITDA growth of 4-8% expected for FY2026, highlighting pricing power and margin discipline with steady deleverage momentum and moderate organic sales growth.
- Siemens Aktiengesellschaft – FY2026 Q1 results for October to December 2025: Revenue of €19.1 billion (+4% nominal, +8% comparable) and Orders of €21.4 billion (+7% nominal, +10% comparable), indicating strong order growth with a book to bill ratio above 1. Profit Industrial Business of €2.9 billion with a margin of 15.6%, Net income of €2.2 billion, and EPS of €2.60. Free cash flow of €0.7 billion. FY2026 revenue growth outlook increased to 6-8% comparable, highlighting industrial leverage.
- SoftBank Group Corp – FY2025 Q3 results for the nine months ended December 31, 2025: Net income attributable to owners of the Company of ¥3,172.7 billion (+398.7% YoY), Net sales of ¥5,719.2 billion (+7.9% YoY), and Income before income tax of ¥4,169.2 billion. Total gain on investments of ¥4,220.3 billion driven by Vision Fund performance. NAV of ¥33.3 trillion, up from ¥30.9 trillion, with controlled LTV of 16.5%.
- Hermès International S.A. – Full Year 2025 results: Revenue of €16,002 million, with a +5.5% change at current rates and a +9% change at constant rates. Recurring operating income of €6,569 million, a 41.0% margin, and a +7% change. Net profit of the group for the year: €4,524 million. Adjusted net profit: €4,855 million, a +5.5% change. Earnings per share: €43.15. Adjusted free cash flow: €3,880 million, a testament to the exceptional margin and capital management discipline of the luxury segment.
- Unilever PLC – Full Year 2025: Turnover of €50.5 billion. Underlying sales growth of +3.5%, of which +1.5% volume growth. Underlying operating profit of €10.1 billion, a 20.0% margin, and a +7% change. Operating profit of €9.0 billion, a +2.4% change. Underlying earnings per share of €3.08, a +0.7% change. Diluted earnings per share of €2.59, a +6.2% change. Free cash flow of €5.9 billion. Underlying sales growth of 4-6% and at least +2% volume growth expected for 2026, with a slight increase in margin.
- Brookfield Corporation – Full Year 2025: Distributable earnings before realizations of $5.4 billion, or $2.27 per share, a +11% increase per share. Total distributable earnings of $6.0 billion, or $2.54 per share. Consolidated net income of $3.2 billion, a testament to the exceptional earnings growth of the asset management segment.
- L’Oréal S.A. – Full Year 2025: Sales of €44.05 billion, a +1.3% change and a +4.0% like-for-like change. Operating income of €8.89 billion, a +2.4% change. Net income of €6.13 billion. Adjusted net income of €6.81 billion. Earnings per share of €12.71, a +0.4% change. Dividend per share of €7.20, a +
- Morningstar, Inc. – Full Year 2025 Revenue of $2.45 billion, organic +8.0%, Net income of $374.2 million, and EPS of $8.87 were reported by the company. Revenue for Q4 stood at $641.1 million, or +8.5% YoY, while Net income for Q4 stood at $115.1 million, and EPS at $2.83, or $2.71 on an adjusted basis.
- Pinterest, Inc. Class A – Revenue for the full year 2025 stood at $4,222 million, or +16% reported and +15% constant currency growth. Revenue for Q4 stood at $1,319 million or +14% reported growth, while Net income for Q4 stood at $277 million, and EPS at $0.67. The company reported a record 619 million global MAUs, or +12% YoY.
- Rivian Automotive, Inc. Class A – Full Year 2025 Vehicle deliveries of 42,247 were reported by the company, while Gross profit turned positive at $144 million, marking the first full year of positive gross profit. Net loss stood at $3.6 billion, with Net loss reported in Q4 of $811 million. The company provided 2026 guidance, including Deliveries of 62,000-67,000, adjusted pre-tax losses of $1.8-2.1 billion, and Capex of $1.95-2.05 billion.
- Arista Networks, Inc. – Revenue for the full year 2025 stood at $9.006 billion, or +28.6% YoY and a new company record. Non-GAAP gross margin stood at 64.6%, while Non-GAAP operating margin stood at 48.2%. Revenue for Q4 stood at $2.49 billion or +28.9% YoY, while Q4 Adjusted EPS stood at $0.82. The company provided 2026 guidance, including 25% revenue growth or $11.25 billion, with AI networking of $3.25 billion.
- Agnico Eagle Mines Limited – Full Year 2025 Report Payable gold production for the full year came in at 3,447,367 ounces. Revenue for Q4 came in at $3.56 billion, up 60.3% year over year. Net income for Q4 was $1,523 million. Adjusted net income for Q4 came in at $1,351 million or $2.70 per share. Cash from operations for the full year came in at a record $6,817 million or $13.58 per share. Free cash flow for the full year came in at a record $4,399 million or $8.76 per share. Production costs per ounce averaged $965.
Today’s Earnings Preview, February 13, 2026
- Safran SA – Earnings expected today. Investors should look for revenue trends, operating margin performance, aerospace backlog trends, and forward guidance for 2026.
- Enbridge Inc. – Earnings expected today. Investors should look for operating cash flow generation trends, dividend sustainability, capital discipline, and leverage.
- TC Energy Corporation – Earnings expected today. Investors should look for pipeline throughput trends, free cash flow sustainability, and balance sheet strength.
- Tokyo Marine Holdings, Inc. – Earnings expected today. Investors should look for underwriting margins, reserve adequacy, investment income trends, and capital return.
Stock Market Overview – Friday, 13 Feb 2026
The US stock market continues to face challenges as investor confidence declines due to the weakening of the technology sector, increased investment risks in AI, and macroeconomic factors related to inflation and interest rates. The S&P 500 index continues to face difficulties due to the lack of broad participation and the presence of concentrated sectors. At Zaye Capital Markets, we see the stock market experiencing volatility due to mega-cap re-pricing and risk re-balancing due to inflation data.
Stock Prices
Economic Indicators and Geopolitical Developments
Macro sentiment remains shaped by inflation expectations, AI-driven capital expenditure uncertainty, and global growth recalibration. Treasury yields have eased modestly as investors seek safety, reinforcing the defensive tone. Market breadth continues to lag index concentration, underscoring structural fragility beneath headline performance.
Latest Stock News
- $NBIS is gaining increased institutional interest due to the expansion of the management team from 7 data center sites in 2025 to the current 16 sites. The company plans to spend $16-$20B on CapEx to expand the AI data center presence and has access to more than 60% of the funds internally through cash flow. The revenue growth indicates the aggressive growth strategy of the company: $7M on Dec 23, $35M on Dec 24, 5 times YoY growth, $228M on Dec 25, 6.5 times YoY growth, and $1.4B on Dec 26, 6 times YoY growth.
- $GOOGL has launched its Gemini “Deep Think,” an AI mode that can transform sketches into actual designs that can be printed out in 3D. If adopted, Google would structurally integrate itself into product designs and development.
- $AAPL has fallen by over 5% today, its biggest decline in a single day over the past 10 months. It also has seen its business identity continue to be a topic of controversy. If considered a mere ad network for gaming, margin pressure is still a concern. However, if MAX is considered a platform between users and outcomes, its valuation thesis is altered.
- $RKLB is gearing up for its fourth test launch with its HASTE rocket from the Pentagon later this month, which would solidify its partnership with DoD.
- $MSFT has seen its AI leadership state that accounting and legal professional activities may be automated within 12 to 18 months.
The Magnificent Seven and the S&P 500
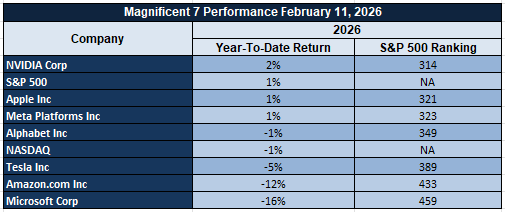
The Magnificent Seven, which includes Apple, Microsoft, Nvidia, Amazon, Meta, Alphabet, and Tesla, continue to play a vital role in determining market direction. Their pullback is still weighing on both the S&P 500 and the Nasdaq Composite. The concentration risk is still elevated, and skepticism regarding capital intensity and AI monetization timelines has seen an increase in volatility across the entire tech sector.
Major Index Performance as of Friday, 13 Feb 2026 (latest available pricing)
- Nasdaq Composite: 22,597.15, down 2.04%
- S&P 500: 6,832.75, down 1.57%
- Russell 2000: 2,612.19, down 2.15%
- Dow Jones Industrial Average: 49,451.88, down 1.34%
Here at Zaye Capital Markets, we take a selective and disciplined approach to allocation. Mega cap sensitivity driving the indexes will require confirmation through improving breadth and stabilization in the technology leadership before risk can be sustained.
Gold Price: How Inflation Data and Policy Shifts Are Affecting Current Gold Prices
Currently, the spot gold price is trading at around $5,012 per ounce, as of Friday, 13th February 2026, and has been maintaining the recent historic highs after a brief dip earlier in the week. This has been a volatile move for gold, initially falling on the back of stronger labor data, which has put upward pressure on the dollar and lowered the probability of rate cuts. However, recent geopolitical events and regulatory announcements are once again creating uncertainty in the markets. Some of the recent events include the administration’s revocation of the 2009 climate endangerment finding, selective re-engagement with international bodies, changes in Middle East diplomacy, and changes in China-related technology restrictions. These are creating layers of policy uncertainty for investors. Investors are also awaiting the release of the US core CPI m/m, CPI m/m, and CPI y/y data. If inflation data prints stronger than expected, a prolonged period of rate hikes would put upward pressure on the dollar and weigh on gold prices in the short term. However, a stronger inflation rate would be positive for gold, making it a hedge for inflation risk. If the inflation data prints softer than expected, a weaker dollar would provide support for gold prices.
Yesterday’s economic indicators have reinforced this tension-driven environment. Favorable labor market indicators have tempered any near-term rate cut expectations, supporting dollar strength and a brief consolidation in gold. However, the persistence of high unemployment duration and balanced participation rates indicates underlying economic tensions. In this environment, gold will continue to benefit from its dual narrative of inflation risk and policy-driven geopolitical risk. The ongoing nature of Middle East stabilization efforts, trade framework adjustments, and potentially impending diplomatic timetables with Iran will continue to support safe-haven assets. As investors contend with inflation uncertainty and regulatory and geopolitical shifts, the positioning of gold above $5,000 represents structural drivers related to monetary policy expectations, currency stability concerns, and global risk hedging dynamics.
Oil Prices: How Inflation Data, Policy Signals and OPEC Outlook Are Driving Oil
As of now, the price of Brent crude oil is trading around $67.05 per barrel, and the price of West Texas Intermediate (WTI) crude oil is trading around $62.59 per barrel. These are the prices of crude oil on Friday, i.e., on the 13th of February, 2026, according to the latest session pricing. These prices are below the recent high of $70 for Brent and $66 for WTI crude oil. This shows consolidation in the crude oil market after a strong rebound in crude oil prices from their recent low in December. Diplomatic efforts to reach a potential deal with Iran, calming tensions in the Middle East, and adjustments to trade positioning are helping to calm market concerns about crude oil supplies. However, crude oil prices are not rising due to the fact that output discipline by OPEC+ has not been sufficient to spark a tightening market, and IEA projections show that demand growth will moderate in 2026. Inventory builds in the US and growing output outside of OPEC are keeping crude oil prices capped in a trading range rather than sparking a supply-driven rally.
Better labor data from yesterday supported the dollar, reducing the likelihood of rate cuts and putting downward pressure on oil, given the dollar-denominated price of oil and the sensitivity of oil prices to global growth forecasts. Today, the release of the US Core CPI m/m, CPI m/m, and CPI y/y data is a major inflection point for oil prices. If inflation data are released above expectations, oil prices are expected to strengthen the dollar, sustain the case for a higher rate for longer, and reduce demand forecasts, particularly for transportation and industrial consumption, putting oil prices under pressure. If inflation data are released below expectations, oil prices are expected to weaken the dollar, increase risk appetite, and strengthen demand forecasts, potentially pushing Brent back towards the $69-$70 range and WTI towards $64-$65. Regulatory changes favoring domestic production and shifting geopolitics are important factors affecting oil prices, but from a short-term perspective, oil prices are driven by macro factors. In this regard, oil prices are driven by inflation forecasts, dollar movements, and demand revisions, and are less driven by supply factors.
Bitcoin Prices: How CPI Data, Macro Liquidity, and Policy Changes Are Impacting Bitcoin
Bitcoin is currently trading at $66,300 as of Friday, 13th February 2026, after experiencing a sharp correction from the highs of the mid-$90,000 range during January. The sharp correction to the $66,000 price range can be attributed to the increased risk-off scenario in the market as equities and other high-beta assets are experiencing the same phenomenon due to delayed rate cut expectations and the resulting liquidity crunch. Recent policy changes, including the highly publicized deregulatory shift in the form of a major regulatory reversal, changes in the trade frameworks, selective pauses in the regulation of technologies related to China, diplomatic efforts related to Iran negotiations, discussions related to the stabilization of the Middle East, are not directly related to the crypto market but are impacting the market in a macro manner. Bitcoin is highly correlated with macro factors, and whenever there are changes in the political and regulatory environment, the dollar tends to attract more capital before the flow of funds resumes to the crypto market. Recent data on exchange flows indicates increased inflows to centralized exchanges, thereby impacting the price in the short term, whereas the activity of large wallets indicates increased accumulation by long-term investors, and the increased anxiety levels indicated by the sentiment indicators suggest that the market is currently consolidating rather than trending.
The stronger labor market data from yesterday has strengthened the case for a higher-for-longer interest rate environment, which is positive for the US dollar and puts pressure on Bitcoin due to its relationship with liquidity expectations and real yields. The US Core CPI m/m, US CPI m/m, and US CPI y/y scheduled for today are key releases that will provide directional bias. A stronger-than-expected inflation number may prolong the consolidation below $68,000, while a weaker inflation number may weaken the dollar, strengthen risk appetite, and allow Bitcoin to test resistance levels towards the $70,000 zone. The market is still commenting on the relationship between Bitcoin’s price movements and macro liquidity conditions, as opposed to any fundamental crypto-related factors. Therefore, unless macro policy expectations shift significantly, consolidation is likely to continue. The macro environment is currently favoring Bitcoin, which is being driven by inflation data, dollar movements, and equity markets.
ETH Prices: How ETF Flows, Whale Activity, and Macro Liquidity Are Impacting Ethereum
Ethereum has been trading close to $1,940 for each ETH on Friday, February 13th, 2026, oscillating just below the crucial $2,000 psychological barrier after an extended period of negative price movement for digital assets. In recent times, there has been significant outflow activity for U.S. spot Ethereum ETFs, with a combined outflow of more than $100 million in the past week alone. This has put additional selling pressure on the digital asset, especially considering that many of these ETFs are still underwater compared to their average entry points. At the same time, there has been evidence of whales moving and redistributing their supply. While there are some signs of accumulation by whales and large wallet holders of Ethereum near recent lows, there has been a general reduction in dominance for whales and large wallet holders of Ethereum as a percentage of circulating supply. This has further cemented the consolidation pressures below $2,000, with technical resistance building up around the $2,100-$2,150 range and technical support around $1,750-$1,800.
Macro conditions continue to dictate the market. The delay in rate cut expectations due to positive labor market results has strengthened the US dollar and tightened macro liquidity conditions, impacting high-beta assets such as Ethereum. ETF outflows and a strengthening dollar have capped upside momentum, despite short-covering moves. The US Core CPI m/m, CPI m/m, and CPI y/y results announced today are a crucial market catalyst. A higher-than-expected inflation result may reinforce the higher-for-longer rate environment, maintaining pressure on risk assets and potentially driving ETH into lower support zones. Conversely, a lower inflation result may reduce dollar strength, improve macro liquidity conditions, and encourage institutional inflows into digital asset ETFs. For now, the Ethereum ecosystem is closely linked to macro liquidity conditions, ETF flows, and whale positioning. The price action is an extension of cautious accumulation.
