Where Are Markets Today?
The United States and European stock index futures are opening flat to lower this morning, with the S&P 500, Nasdaq 100, and Dow Jones futures all down by 0.1% as a result of the gains experienced in the past session. The Dow Jones hit a new intraday and closing high in the past session, while the Nasdaq was up by almost 1% as technology stocks continued to build on the rally seen on Friday. However, the futures for today are indicating a cautious start to the day for the markets as investors seem to be waiting for some major macroeconomic announcements that will be made in the coming days. The European markets seem to be struggling for direction in the futures market, with the DAX and CAC futures in Germany and France, respectively, being flat. This comes at a time when the global markets seem to be in a state of flux, with investors being cautious about the various announcements that will be made in the coming days, including the United States retail sales data to be released in the morning and the inflation data to be released on Friday, in addition to the geopolitical tensions regarding the buildup of defense in the Arctic region and the strategic energy routes.
A significant factor that is contributing to the flat futures is the market’s response to last week’s minor correction and the plethora of economic indicators that are being reported this week. The market is digesting a variety of different macroeconomic indicators that are being reported, including the mixed employment numbers for the United States, the upcoming inflation numbers that will have a significant impact on the Federal Reserve’s interest rate decisions, and the upcoming retail earnings that will be reported. A robust retail earnings report today will likely cause investors to begin to rotate into cyclical and discretionary assets, but a poor report will likely cause investors to further believe that the economy is slowing. The market is also paying close attention to the upcoming earnings season, which includes key bellwethers such as Coca-Cola, Hasbro, and Spotify. Despite the strong gains that were reported on Monday, especially for technology and communication services, investors are not chasing the market too high without the confirmation that will be provided by the economic indicators that are reported this week. The geopolitical tensions that have risen in the Middle East are also a significant factor that is contributing to the flat futures. The White House’s opposition to the annexation of the West Bank by the Israelis, the increasing military readiness in the Arctic under the NATO “Arctic Sentry” program, and the maritime warnings that have been given in the area of Iran have caused investors to take a defensive position. The announcements that have been given related to the upcoming visit by the President to China in April and the new trade deals that have been agreed to with India and Bangladesh are also a factor that is contributing to the flat futures. While these announcements are likely to have a positive impact on trade, they are also creating a sense of uncertainty related to the alignment of different regions of the world.
At Zaye Capital Markets, our interpretation of current flat futures positioning is that it reflects strategic caution. With indexes making important technical breakthroughs, such as the S&P 500 reclaiming its 50- and 100-day moving averages, traders are bullish, albeit with a sense of caution, particularly as they await CPI and labor market data that will dictate positioning for Q1. In Europe, mixed inflation data and a weaker Euro are clouding the picture, as is the ECB’s dovish tone, which remains a headwind for growth stocks. The overall message here, however, is that momentum has indeed returned, though conviction remains an open question, particularly as this week’s data and geopolitical events dictate whether futures continue to consolidate or extend recent gains.
Major Index Performance as of Tuesday, 10 Feb 2026
- S&P 500: Currently trading at 6,969.01, up modestly on the back of broad sector strength.
- Nasdaq Composite: Currently trading at 23,267.98, up on the back of rebounds in the tech sector and improving sentiment in the semiconductor space.
- Dow Jones Industrial Average: Currently trading at 50,152.28, holding above the 50,000 mark on the back of broad sector support from industrials and financials.
- Russell 2000: Currently trading at 2,670.34, up on the back of improving risk sentiment and increasing confidence in the recovery of small-cap earnings.
The Magnificent Seven and the S&P 500
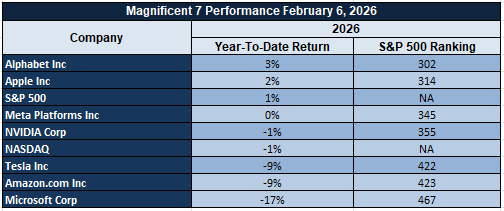
The Magnificent Seven stocks, comprising Apple, Microsoft, Nvidia, Amazon, Meta, Alphabet, and Tesla, have faced challenges over the last few weeks due to the emergence of concerns over AI spending and profitability. The substantial capital expenditures planned for 2026 have raised short-term investor concerns, especially for those stocks with higher AI spending. This has resulted in an increase in the concentration risk of the S&P 500. The underperformance of the Magnificent Seven stocks has created challenges for the S&P 500 and the Nasdaq Composite.
Drivers Behind the Market Move – Tuesday, February 10, 2026
In a market environment characterized by fresh macroeconomic data, increased geopolitical events, and shifting narrative surrounding international trade, there are three major drivers currently affecting markets.
1. Anticipation Around U.S. Retail Data and Earnings
Today’s release of retail sales and core retail sales data is causing markets to exhibit caution ahead of today’s release. This comes as markets opened slightly lower today after yesterday’s positive move that saw the Dow Industrial Average set a fresh record high. Retail sales are important data this week and are causing markets to gauge whether or not the current strength in retail sales will begin to slow. This comes as recent data showed that the labor market and inflation are sticking higher. In addition to this week’s retail sales data, investors are also looking to see how several major companies, such as Coca-Cola, Hasbro, and Spotify, are positioned from a forward-looking perspective.
2. Geopolitical Positioning and Risk Premiums
The geopolitical tensions were heightened by comments from the White House regarding opposition to Israeli annexation of the West Bank, coupled with the pending “Arctic Sentry” mission by NATO and new guidelines for vessels operating in Iranian waters. Additionally, the announcement of an upcoming presidential visit to China in April, along with new trade agreements with India and Bangladesh, represent a dual policy of containment and diplomacy. While the former represents concerns regarding stability and defense expenditures within those regions, the latter represents new trade flows and potential shifts in industrial and energy supply chains that are being factored into global equity and commodity prices.
3. Policy Shifts and Sector Price Adjustments
The new compact between the administration and data center developers aimed at reducing strain on the power grid and requiring infrastructure costs to be borne by developers is resulting in a sector pricing of cloud and digital infrastructure plays. Additionally, efforts to limit appeal options for dismissed federal workers signal broader policy shifts regarding the overall labor landscape that could impact overall federal budget allocations. These policy shifts are being digested by the market along with overall global inflation trends, particularly with regard to European economies where softer inflation data has resulted in tempering expectations regarding ECB policy decisions. As such, European equities are exhibiting a sense of optimism with mixed futures and retail strength in the U.K.
As such, the overall market today is digesting a combination of economic anticipation, geopolitical recalibrations, and policy shifts that are resulting in a relatively muted futures environment as investors digest overall global policy movements.
Digesting Economic Data
The TRUMP Tweets and Their Implications
We at Zaye Capital Markets note that recent commentary out of the White House and associated policy moves appear to be having significant effects on global markets, which carry important macroeconomic and geopolitical implications. A series of tweets opposing the annexation of the West Bank and emphasizing stability as key to Israeli security appear to have subtly influenced geopolitical risk premiums, which manifest as key drivers of repricing in various geopolitical risk hedges, including gold and fixed income assets of various types. Meanwhile, the NATO announcement of the confirmed plan and expected launch of the “Arctic Sentry” mission to bolster surveillance and defense posture in the Arctic region introduces another layer of fundamental uncertainty that cannot be ignored by investors in the Arctic region or the world at large. NATO’s mission planning to the Arctic region can be seen as an escalation of strategic posturing in Northern Europe, particularly in the wake of tensions surrounding the sovereignty and security of Greenland that arose as a result of continued commentary regarding U.S. interests in the region.
Meanwhile, the renewed emphasis on trade policy, such as fact sheets on the reciprocal trade agreements with India and Bangladesh that reduce tariffs on industrial products, is changing the course of global trade routes. While these moves are likely to provide greater access for US businesses, the reality is that these moves are part of a much broader environment of policy unpredictability, from the AI infrastructure directives to balance the power costs of homes to the executive order on the export of defense products to the highest-spending countries. The most recent statements on maritime guidance with respect to the Strait of Hormuz, as a result of the Iran-related security concerns, are creating a challenging environment with respect to the pricing of energy supplies.
The reality is that these tweets and policy statements are creating a market environment where the diplomatic strategies, the trade rebalancing, and the policy strategies on defense are creating an environment where the asset classes, from commodities to safe havens to defense stocks to emerging markets, are likely to be impacted by these policy statements.
February Economic Data Cluster Flags Inflation Risk, Labor Revision Fallout
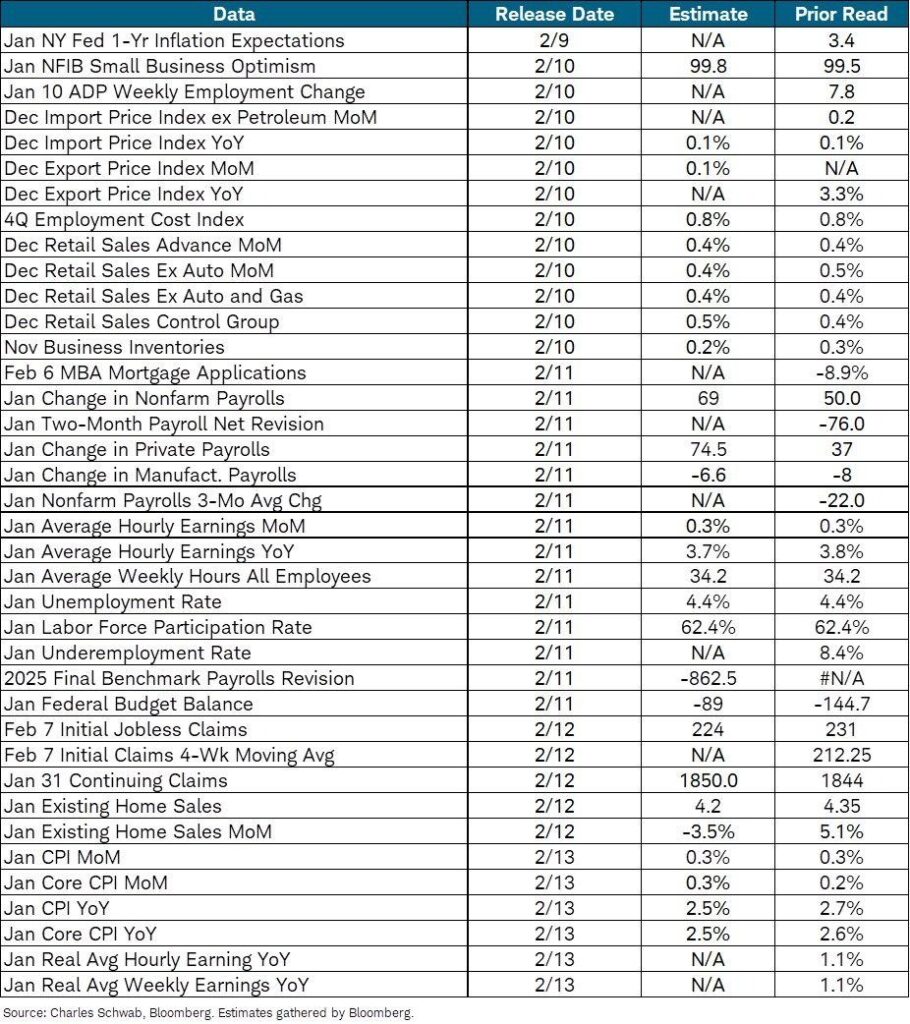
We at Zaye Capital Markets are closely watching a congested economic schedule for the week of February 9-13, which is likely to significantly impact market positioning for asset classes. The non-farm payroll, inflation, and GDP growth rate are due for release in a condensed time frame, reflecting market volatility. The non-farm payroll jobs figure reveals a gain of 69,000 jobs, a lackluster number that is a marginal increase from 50,000 jobs created in the prior month. The real story may be revealed by the annual non-farm payroll revision, which is due at -862,000 jobs. This will indicate that jobs created in 2025 were greatly exaggerated, calling into question the robustness of last year’s economic expansion.
The implications of such a sharp downward revision are significant. A much lower employment base changes the perspective with which investors and the administration look at productivity growth, wage inflation, and consumer resilience. It also indicates that a significant part of the growth may have been contributed by capital augmentation and technology rather than an increase in the labor pool. In addition to this, the upcoming inflation data release is also significant as it is expected to increase by 0.3% month over month. A higher-than-expected inflation release would spark the fire for a prolonged period of restrictive policy.
With the above-mentioned backdrop in place, we believe Salesforce is a stock that is undervalued compared to its future operating prospects. Salesforce’s business is a deeply embedded enterprise software business with a strong presence across industries. Its business is also insulated from the broader labor market as its software business benefits from the broader trend towards corporate digitization and automation, which tends to accelerate whenever labor costs grow faster than the employment pool. Analysts must keep a close eye on wage growth data, participation rate data, service inflation stickiness, and productivity growth data to understand if the market is underpricing the defensive nature of enterprise software’s earnings growth.
Gallup Poll Reveals Economic Confidence Split, Flags Late-Cycle Risk Pattern
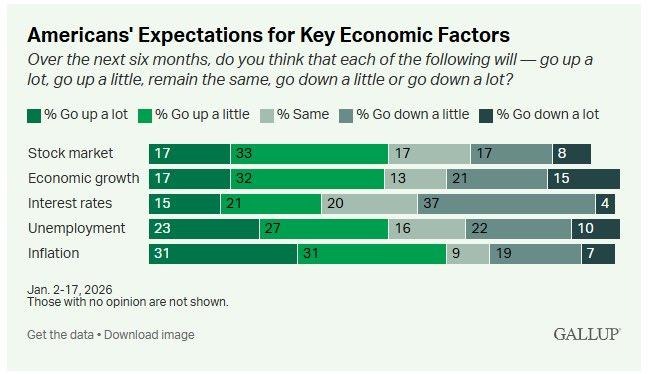
We at Zaye Capital Markets are reviewing the latest Gallup Economy Poll results from the survey conducted between February 1-17. The results show a sharp split in the US public’s economic confidence. While 50% of the public expects the stock market to go up, with 49% expecting the US economy to grow in the next six months, 62% of the public expects inflation to go up, with 50% expecting the unemployment rate to go up by 12 points from the earlier results of 2025. We believe that historically, such a split in the public’s economic confidence reflects the typical late-stage economic cycle where asset bubbles tend to develop despite deteriorating economic fundamentals.
The split in the public’s economic confidence is likely a result of the recently introduced economic policies that are boosting the public’s confidence in the financial markets, while the policies are yet to boost the public’s confidence regarding inflation. As recently reported, the core inflation rate is currently at 3.2%, a rate much higher than the policy makers’ comfort level, which indicates that inflation is likely to dampen demand. Furthermore, the sharp increase in the unemployment rate is consistent with a weakening labor market, which will likely negatively impact the earnings of companies. As shown by the historical trends of the Gallup poll, a split in the public’s economic confidence is consistent with a 5-10% pullback in the stock market, as the split reflects a weakening labor market.
In light of the above, we are of the view that Procter & Gamble is an undervalued defensive stock that is likely to perform well despite the deteriorating economic conditions. Unlike the high-growth sectors that are vulnerable to the economic downturn, the consistent earnings and dividends of the company make it a preferred option for investors in the context of the late-stage economic cycle.
Upcoming Economic Events
Core Retail Sales m/m and Retail Sales m/m – Market Sentiment Will Depend on Strength in These Figures
With markets facing an environment dominated by policy uncertainty, soft labor markets, and stubborn inflation pressures, investors now turn their attention to an important test of consumer strength: retail sales data through February. The upcoming data release includes both Core Retail Sales m/m (which excludes auto sales) and Retail Sales m/m. These reports provide useful information regarding consumer spending patterns and household resilience in the face of rising prices.
Retail Sales m/m: The Broader Consumer Spending Report
The Retail Sales report represents over two-thirds of all consumer spending in the economy. The data is often seen as a harbinger of future shifts in corporate earnings, GDP growth, and monetary policy.
- If actual Retail Sales beat expectations, consumer strength is seen to be intact. This would likely be positive for markets, supporting stock prices, lifting interest rates in response to growing economic optimism, and lowering the potential for rate cuts.
- Conversely, if Retail Sales fall short of expectations, investors would likely worry that consumers are losing purchasing power due to rising prices and stagnant wages.
Core Retail Sales m/m
The Core Retail Sales release is even more closely watched by institutional analysts, who will strip away the influence of the automobile sector to get a clearer read on underlying consumer trends.
- A better-than-expected Core Retail Sales release could re-ignite the market’s enthusiasm for the economy’s internal engine, especially if supported by the recent resilience in employment numbers. This could further fuel the soft-landing scenario.
- On the flip side, a poor Core Retail Sales release could have even more damaging implications than the initial Retail Sales release, which could indicate that even the most mundane spending is slowing. This could negatively impact market sentiment, lower earnings estimates for the consumer discretionary sector, and even flatten the yield curve.
Analysts at Zaye Capital Markets will be paying particular attention to the categories of spending, including apparel, electronics, and home furnishings, to get a sense of where discretionary spending is being directed. In essence, this release will not only inform us about the behavior of the consumer but also potentially set the tone for market direction going into March.
Stock Market Performance
Indexes Extend Gains Since April, But Member Drawdowns Highlight Uneven Recovery
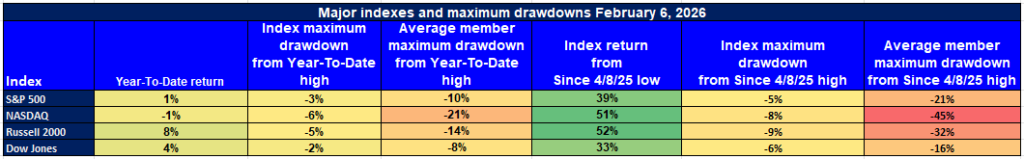
The U.S. stock market indexes have continued their recovery since their low on April 8, 2025. This has led to strong index returns through February 2026. However, as we at Zaye Capital Markets observe, the stock market’s performance also reflects the fact that the average stock’s drawdown still signals an uneven recovery. This is because, while stock market indexes like the Russell 2000 or NASDAQ have shown strong stock market index performance, the stocks that make up these indexes are still showing high volatility.
S&P 500: Resilience with Shallow Index Pullback, But Members Lag
YTD: +1% | +39% off April low | -3% max drawdown from YTD high | Avg. member: -10%
The S&P 500 has shown modest stock market index performance in 2026. It has gained 1% year to date. It has also gained 39% since its low in April. However, the stock market’s maximum drawdown of 3% since the YTD high belies the fact that the stocks that make up the S&P 500 are averaging a 10% drawdown since their YTD high.
NASDAQ: Impressive Rebound Overshadowed by Member Volatility
YTD: -1% | +51% off April low | -6% max drawdown | Avg. member: -21%
Despite a massive 51% increase from the lows seen in April, the NASDAQ is down 1% year to date in 2026, reflecting a 6% drawdown from the highs. The more worrying factor is the 21% average drawdown seen in the NASDAQ members. This is a clear indicator of the underlying fragility in the technology sector that is impacting the confidence in the upward trajectory.
Russell 2000: Small-Cap Surge Faces Hidden Drawdown Risk
YTD: +8% | +52% off April low | -5% max drawdown | Avg. member: -14%
The year 2026 is off to a roaring start for the Russell 2000, which is up 8% year to date. This is a result of the 52% increase seen from the 2025 lows. While the underlying returns for the index are robust, the underlying drawdowns seen in the members average 14%.
Dow Jones: Most Stable Profile, Yet Member Stress Persists
YTD: +4% | +33% off April low | -2% max drawdown | Avg. member: -8%
The Dow Jones is up 4% year to date and is showing a 2% drawdown from the highs. This is the most stable of the four major indices. However, even in the Dow Jones, the underlying drawdowns for the members average 8%.
As Zaye Capital Markets, we recommend a tactical approach to the market. We recommend focusing on high-quality equities that have lower volatility, more free cash flows, and are more immune to sector risks. The underlying breadth is key to understanding the viability of the upward trajectory.
The Strongest Sector in All These Indices
Energy Leads 2026 Performance, Reinforced by Global Demand and Defensive Flows
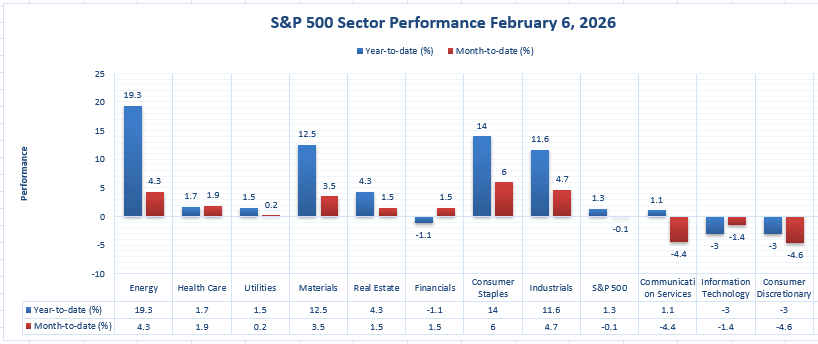
Based on data up to February 6, 2026, at Zaye Capital Markets, we recognize that the Energy sector is currently the strongest in all S&P 500 sectors. The sector is also delivering the strongest year-to-date returns and is showing impressive month-to-date gains. Currently, the Energy sector is up by +19.3% year to date and is up by +4.3% month to date. The sector is clearly dominating all other industry groups in the S&P 500 by a huge margin. The sector is benefiting from favorable commodity prices, prudent capital expenditure, and rising demand globally amidst prevailing geopolitical tensions.
What is also noteworthy is that while the Energy sector is delivering both year-to-date and month-to-date returns, there is no other sector that is able to deliver returns even close to that of the Energy sector. The next closest competitors to the Energy sector in terms of year-to-date returns and month-to-date returns are the Consumer Staples sector and the Materials sector. The Consumer Staples sector is up by +14.0% year to date, while the Materials sector is up by +12.5% year to date. The Energy sector is also delivering one of the top returns in terms of month-to-date gains. The Energy sector is in the top three in terms of month-to-date gains. The sector is second only to the Consumer Staples sector and the Industrials sector. The Consumer Staples sector is up by +6.0% month to date, while the Industrials sector is up by +4.7% month to date. Therefore, we can confidently assert that this is not just a residual effect from last year; rather, there is institutional conviction in the sector.
The Energy sector is clearly benefiting from its free cash flows, discipline in supply, and growing evidence of an integrated energy model that combines fossil and transitional energy. The sector is benefiting from investors who view it as an inflation hedge that can provide yield stability and margin sustainability. We would recommend that analysts pay close attention to oil inventory data, policy shifts in OPEC, and shifts in U.S. rig counts in assessing whether or not this trend is sustainable.
Earnings
Earnings Recap – Yesterday (09‑Feb‑2026)
Cross‑Sector Results Highlight Margin Strength and Forward Momentum
We at Zaye Capital Markets assess the February 9, 2026 earnings releases as broadly constructive, with firms across services, finance, real estate, and diversified holdings posting resilient results. Profitability, margin expansion, and capital discipline were dominant themes, reinforcing selective optimism despite macro headwinds.
- Upwork Inc. reported Q4 revenue of $198.4 million and full‑year revenue of $787.8 million, marking a record year. GAAP net income reached $15.6 million for the quarter and $115.4 million for 2025, while adjusted EBITDA totaled $52.9 million in Q4, representing a 27% margin. Full‑year adjusted EBITDA rose to $225.6 million, also a record. Adjusted diluted EPS stood at $0.36, reflecting improving operating leverage and expanding profitability within the freelance services ecosystem.
- Apollo Global Management, Inc. delivered strong earnings momentum, with Q4 GAAP net income attributable to common shareholders of $660 million ($1.07 per share) and full‑year GAAP net income of $3.395 billion ($5.58 per share). Adjusted net income reached $1.54 billion ($2.47 per share) in Q4 and $5.195 billion ($8.38 per share) for the year. Fee‑related earnings totaled $690 million in Q4 and $2.528 billion for 2025, while spread‑related earnings reached $865 million in Q4 and $3.361 billion annually. Total AUM stood at $938 billion, with $709 billion in fee‑generating assets and $228 billion in full‑year inflows.
- Mitsubishi Estate Co., Ltd. reported nine‑month operating revenue of ¥1.21 trillion and operating profit of ¥227.37 billion, up from ¥194.48 billion year over year. Profit attributable to owners reached ¥156.53 billion, compared with ¥105.79 billion previously. Based on this momentum, management raised full‑year FY2025 profit guidance to ¥220 billion from ¥195 billion, signaling improved visibility in commercial property and urban development operations.
- Loews Corporation generated Q4 net income of $402 million ($1.94 per share) and full‑year net income of $1.667 billion. Q4 revenue increased to $4.734 billion from $4.546 billion year over year, reflecting steady contributions from insurance, energy, and hospitality assets. These results underscore the stabilizing effect of diversification during periods of uneven economic expansion.
Earnings Preview – Today (10‑Feb‑2026)
Broad Industry Coverage Expected to Guide Sentiment and Rotation
Today’s earnings releases (February 10, 2026) span digital infrastructure, auto manufacturing, staples, analytics, and global banking. We at Zaye Capital Markets believe these results will help investors reassess inflation sensitivity, demand stability, and capital strategy across sectors.
- Cloudflare, Inc. is scheduled to report results today, with consensus expectations centered on continued revenue expansion and improving operating leverage. Investors will focus on enterprise customer growth, network usage trends, and margin discipline as indicators of sustainable demand for cloud security and performance services.
- Ford Motor Company is expected to provide insight into industrial and consumer durability through vehicle sales trends, electric vehicle profitability, and cost management. Market participants will assess inventory levels, pricing power, and supply‑chain efficiency to gauge margin sustainability.
- Ecolab Inc. is set to release earnings reflecting conditions in hospitality, healthcare, and industrial services. Analysts will monitor organic revenue growth, pricing realization, and contract renewal trends as measures of customer resilience and cost‑pass‑through capability.
- S&P Global Inc. will report results tied to demand for financial data, analytics, and credit services. Attention will center on subscription retention, margin stability, and corporate activity levels, which serve as proxies for broader economic engagement.
- The Coca‑Cola Company is expected to highlight volume trends, geographic performance, and pricing effectiveness. Investors will evaluate whether brand strength continues to offset input cost pressures and shifting consumer spending patterns.
- Barclays Plc is scheduled to report financial performance with focus on return on equity, capital ratios, and investment banking activity. Credit quality, net interest margins, and capital deployment strategy will remain central to assessing sector health.
Stock Market Overview – Tuesday, 10 Feb 2026
The United States stock market opened with a sense of cautious optimism this morning as investors prepare for the release of key inflation and employment data this week. Yesterday, the key stock market indexes rose as technology and chip shares regained traction. In addition, the macro environment remains positive with the Dow Jones industrial average recording a record close. However, investors remain cautious over the significant capital expenditures in the artificial intelligence sector.
Stock Prices
Economic Indicators and Geopolitical Developments
The stock market’s current tone is a result of investors preparing for the January jobs report and inflation data release, which is expected to provide guidance on the future interest rate path for the Fed. Despite the sell-off in the high-growth technology sector earlier in the day, chip and software shares have managed to recover, indicating that investors are taking advantage of the valuation discounts for these shares. In addition, the decline in treasury yields and stable commodity prices also supported the stock market. Geopolitical risks remain contained compared to the past week.
Latest Stock News
• $MU is currently trading lower as the company is facing a threat from Samsung as the latter has already been approved by $NVDA to supply HBM4 chips for its next-generation Rubin platform. In addition, production is set to begin this month. In contrast, Micron Technology is not set to ramp HBM4 production until mid-2026.
• $HIMS’ losses have been extended to around 22% due to the announcement of a lawsuit from $NVO concerning knockoff weight loss medication. The FDA has also indicated that it will fully enforce compounded GLP-1 medication, and Hims has also stated that it has exited the compounded version of semaglutide, sparking investor concerns about the company’s future portfolio.
• $GOOGL is issuing around $15 billion in long-dated bonds due to mature in 2066, among other dates. The funds will be used to finance the company’s increasing footprint in AI infrastructure, using debt to stay at the forefront in the future in compute power at a low cost.
• $AMZN has received a positive note from UBS, stating that the company’s AWS business is set to grow by 38% in 2026. This means that the company’s AI expenditures are being vindicated if the growth is achieved, effectively ending the fear of overbuilding the company’s infrastructure.
• $TSLA continues to be the subject of strategic interest due to its unique optionality in the long term. Analysts note that if Tesla’s autonomy and Optimus projects are successful in the market, the potential for the stock to go higher is unmatched in the market.
• $ONDS’ subsidiary, 4M Defense, has won a $30M+ multi-year autonomous demining contract on the Israel-Syria border, one of the largest land-clearing projects in the history of the state of Israel.
• $META is testing a standalone app called “Instants,” similar to the disappearing photos features on $SNAP’s platform.
• CRDO increased its Q3 FY26 revenue guidance by a significant amount to $406M from its earlier guidance of $340M. Q4 revenue growth is expected to be mid-single-digit sequentially. This keeps them on track to generate revenue growth of over 200% year-over-year.
The Magnificent Seven and the S&P 500

The Magnificent Seven stocks, comprising Apple, Microsoft, Nvidia, Amazon, Meta, Alphabet, and Tesla, have faced challenges over the last few weeks due to the emergence of concerns over AI spending and profitability. The substantial capital expenditures planned for 2026 have raised short-term investor concerns, especially for those stocks with higher AI spending. This has resulted in an increase in the concentration risk of the S&P 500. The underperformance of the Magnificent Seven stocks has created challenges for the S&P 500 and the Nasdaq Composite.
Major Index Performance as of Tuesday, 10 Feb 2026
- S&P 500: Currently trading at 6,969.01, up modestly on the back of broad sector strength.
- Nasdaq Composite: Currently trading at 23,267.98, up on the back of rebounds in the tech sector and improving sentiment in the semiconductor space.
- Dow Jones Industrial Average: Currently trading at 50,152.28, holding above the 50,000 mark on the back of broad sector support from industrials and financials.
- Russell 2000: Currently trading at 2,670.34, up on the back of improving risk sentiment and increasing confidence in the recovery of small-cap earnings.
At Zaye Capital Markets, we continue to emphasize the importance of quality, strong cash flows, and sector diversification. As macroeconomic data is released and has the ability to impact the markets and the Fed’s monetary policy, we would like to highlight the importance of monitoring the movement of earnings revisions, valuation dispersion, and risk premiums as an indicator of confirmation of the health of the rally.
Gold Price: Understanding How Trade Deals, Arctic Deployment, and Retail Data Impact Gold Price
The gold price currently remains steady at around $4,964 per ounce, sustaining an uptrend as markets continue to react to an increase in geopolitical complexities and policy shifts. At Zaye Capital Markets, we are of the opinion that recent activity emanating out of the White House, including opposition to annexation of the West Bank by Israel, NATO’s imminent “Arctic Sentry” deployment, and scheduled diplomatic meetings with China, are all leading to an increase in global risk hedging activity. At the same time, recent activity involving a new draft of a compact on artificial intelligence data centers, aimed at reducing power grid strain and mandating payment for infrastructure, suggests an increase in regulatory activity on technology-based infrastructure projects. These policy-driven market activities have coincided with an expected release of Core Retail Sales and Retail Sales data, due out later today. If this data fails to meet expectations, it could further fuel gold as a risk hedging vehicle, further solidifying gold’s position as a risk-off asset. However, even if this data meets expectations, gold’s uptrend will continue due to an increase in trade realignments with India and Bangladesh, as well as shipping activity with Iran and Venezuela.
The stage is set by Monday’s economic indicators and the White House’s moves. The wage pressures have stabilized, but the deeper revisions to the labor market have created uncertainty around the outlook for 2025. The theme continues today, where the retail numbers will likely gauge the pulse of the economy. Gold continues to have structural support given the constrained real rates and inflation sensitivity. The administration’s approval of the tariff rollbacks for the United States by India and the zero-tariff frameworks for textiles with Bangladesh signal a change from a confrontational approach to trade to a more strategic approach to economic diplomacy. However, the implications for revenue remain unclear, which could have implications for the dollar. We at Zaye Capital Markets believe that the combination of the economy’s softer footing, the tightening of regulations, and the multipolar tensions continues to validate our threefold thesis for gold. Gold will benefit from any political spill-overs, any pause by the Federal Reserve, and any long-term real assets that face the devaluation of fiat currencies and systemic stress. Gold’s price above $4,900 is not a spike; rather, it is anchored.
Oil Prices: How Arctic Tensions, OPEC Supply Cuts, and U.S. Economic Data Are Fueling Oil Price Swings
As of Tuesday, 10 Feb 2026, Brent crude is currently trading at around $68.85 per barrel, while WTI (West Texas Intermediate) crude is currently at $64.15 per barrel, with a slight dip following Monday’s risk-on sentiment. At Zaye Capital Markets, we view the crude oil market as being caught in a balancing act as geopolitical tensions, OPEC cuts, and macroeconomic data increasingly contribute to price volatility. The latest announcement that NATO’s “Arctic Sentry” security deployment is near execution, coupled with new White House guidelines for maritime navigation through the Strait of Hormuz, which is Iran-focused, is further adding to price volatility. The latest OPEC cuts have seen January output at 28.34 million barrels per day, with Nigeria and Libya cutting production, thereby adding an unexpected level of tension at a time when demand prospects are uncertain. The International Energy Agency (IEA) is also predicting a surplus by the end of 2026, which is a counterintuitive sentiment that is likely to have a long-term effect on price movements. The emerging reality is that there is a wide disconnect between real-time risk exposure and long-term balancing, with hedge funds and CTAs aggressively adjusting positions as volatility remains high. The latest moves by the White House to control AI data centers through energy infrastructure mandates are also adding a new dimension to long-term power demand prospects, further adding to an already confusing policy landscape that is difficult to navigate for investors and analysts alike.
Core Retail Sales and Retail Sales data for today will be crucial. A soft reading may indicate a slowdown in the consumer sector and may impact demand softness, which may put downward pressure on oil prices to test the technical supports. A strong reading may support oil prices as it may indicate a strong demand for oil, especially after the sluggish job data and downward revisions in the payroll data released yesterday. Another significant move by the administration of President Trump is the extension of the footprint of the administration’s trade strategy as it entered into reciprocal access agreements with India and Bangladesh to ease tariffs and incentivize U.S. industrial exports. In addition to these changes, the administration’s move to limit the review processes for workers who have been terminated may also impact the market. At Zaye Capital Markets, we believe that the short-term direction for oil prices is subject to a significant degree of volatility based on flashpoint news from the Middle East and the Arctic regions; meanwhile, the macro data for today will dictate the degree to which the energy markets will be influenced by growth or consumption concerns as the OPEC+ meeting is just around the corner.
Bitcoin Prices: The Role of Geopolitical Pressure, Trade Flows, and Economic Data in Bitcoin
Bitcoin is trading in the range of $69,000 to $71,000. The price is recovering from last week’s sell-off that erased gains accumulated in early 2026. Technically speaking, Bitcoin is in a consolidation phase rather than in a trend continuation. According to data from exchanges, Bitcoin is trading above short-term support. The price is still far from recent cycle highs. At Zaye Capital Markets, we view Bitcoin’s price movement as technically driven. The overall environment is quite uncertain. The White House is seeing intense foreign policy activities. These include West Bank positioning and NATO’s upcoming deployment of its “Arctic Sentry” in the near future. Maritime risk guidance is also linked to Iran and Venezuela. Theoretically, these conditions should be favorable to Bitcoin. However, Bitcoin is still behaving like a risk-correlated asset. The price is moving in line with global equities and tech exposure. Other than that, another factor that is contributing to the environment is the potential agreement on an AI data center compact that covers issues like power usage, water consumption, and strain on the electrical grid.
Yesterday’s economic data was in line with the fragile equilibrium described above. The downward revision in labor data and mixed growth indicators reinforced the idea that the global economy is slowing down without the inflation pressure easing enough to cause real yields to collapse. This environment has been supportive for gold in a decisive fashion, but the price action in Bitcoin has been relatively subdued due to ongoing global rotation in asset classes towards defensives and away from high beta assets. Another interesting dynamic to watch in the Bitcoin space is the mining data, where the sharp decline in mining difficulty levels points to the Bitcoin ecosystem adjusting to the price decline, thus providing some relief to the ecosystem but also indicating that the ecosystem is still digesting the price volatility in the recent past. Today’s Core Retail Sales and Retail Sales data releases are crucial for determining the direction in the coming days. If the data comes in weaker than expected, it could be a risk-off move for the market, which could be positive for Bitcoin in the coming days due to the hedge against the weaker economic growth and rate hike concerns. However, if the data comes in strong, it could be a positive sign for the equity market, which could keep Bitcoin range-bound in the coming days due to the increased risk appetite for traditional risk assets. At Zaye Capital Markets, we believe the current levels in Bitcoin are not a capitulation; rather, it is a macro digestion phase where the noise in the global environment due to the ongoing trade tensions, the realignment of trade with India and Bangladesh, and the changing global liquidity conditions are preventing the price from rising decisively while also preventing the price from falling further.
ETH Prices: What ETF Outflows, Whale Accumulations, and Risk Assets Mean for Ethereum Today
As of Tuesday, Ethereum is trading at around $2,100, which is a substantial recovery from the recent lows but still well below the previous levels seen in early 2026. This is due to the ongoing sell-off and consolidation in the broader cryptocurrency market. According to recent market analysis, Ethereum has broken the support levels around the range of $3,000 to $3,200 and declined to the range of $1,900 to $2,050 before stabilizing, indicating that the sell-off is still a dominant force in the market. This has been further compounded by substantial outflows from Ethereum ETFs, which have seen around $3.3 billion leave the market since October last year, with over $500 million exiting the market so far in 2026, thus reducing the total ETF assets under management to below $13 billion, the lowest since the middle of last year. According to Bloomberg Intelligence, the average price paid for the Ethereum ETF investors was around $3,500, meaning they are in substantial unrealized losses and thus raising cash to cover these losses, thus further depressing the price of ETH. However, in the last few days, Ethereum on-chain data shows substantial whale activity, where large investors have strategically withdrawn over $60 million worth of Ethereum from exchanges, thus indicating that these investors are positioning for the medium to long term against the volatility in the market.
The current macro and geopolitical environment, including the latest trade agreements, significant policy shifts, and international tensions, continues to impact all risk assets broadly. Ethereum has not escaped the broader macro environment. Yesterday’s mixed economic data with lackluster labor markets and inflation uncertainty have kept real yields volatile and liquidity mixed. These conditions historically compress speculative asset prices and limit strong bullish runs for all digital currencies. Core Retail Sales and Retail Sales m/m data released today will also influence the market’s perception of future economic conditions. A weaker reading may limit the flow into all risk assets and keep ETH consolidating further. A stronger reading may shift investment flows into equities and keep ETH rangebound until a clear demand catalyst is evident. Whale activity is also evident with significant strategic ETH outflows. Long-term investors may be looking for higher reward opportunities while short-term traders search for technical floors. At Zaye Capital Markets, our assessment is that the short-term direction for Ethereum is driven by ETF outflows and accumulation patterns while the macro environment influences the broader macro risks.
