Where Are Markets Today?
The US and European futures signal a cautiously optimistic opening for the markets today, with the Dow futures slightly higher, S&P futures slightly in the green, while Nasdaq 100 futures showing slightly stronger gains ahead of the highly anticipated earnings release from Nvidia. The European futures are also steady to slightly higher in line with the stabilizing risk sentiment after Tuesday’s rally in US equities. The Wall Street markets closed strongly higher in the last session, with the S&P 500 rising nearly 0.8%, while the Nasdaq was up by about 1% and the Dow rising by nearly 370 points. The markets benefited from easing concerns over AI disruption in the software and cybersecurity space, while a nearly 9% rise in AMD shares after announcing a multi-year AI deal with Meta helped boost sentiment in the semiconductor space.
Two key factors are driving the current futures positioning. The first is that Nvidia earnings are considered an important catalyst for both US and European markets due to the company’s position in AI infrastructure spending and hyperscaler capital expenditures. Investors are currently assessing technology valuations after weeks of volatile movements in the markets. Strong earnings guidance from Nvidia could fuel further upside in both US and European markets. The second factor is that the imposition of a 10% global tariff and the renewed trade rhetoric are acting to reduce risk appetite in the markets. Although the markets initially digested the announcement of the tariffs without any major impact, the overall implications of the tariffs are still being evaluated.
The relief rallies in software and cyber securities are also helping to stabilize the futures markets. The rallies are due to the increasing recognition that AI spending could actually enhance rather than disrupt incumbent business models. The European markets are also benefiting from the spillover of the stabilization in US technology markets but are also vulnerable to the impact of tariffs and currency movements.
From our perspective at Zaye Capital Markets, we believe that the markets are currently risk-on but highly dependent on catalysts. The futures markets are currently benefiting from earnings anticipation and sector-specific relief but are also vulnerable to the impact of tariffs policy, geopolitical risks, and valuation risks.
Major Index Performance as of Wednesday, 25 Feb 2026
- NASDAQ: Trading near 22,864, up +1.0%, with a tech rebound in select names driving the Nasdaq.
- S&P 500: Trading near 6,890, up +0.8%, with a moderate improvement in breadth.
- Dow Jones Industrial Average: Trading near 49,175, up +0.8%, with industrial and defensives leading the Dow.
- Russell 2000: Trading near 2,653, up +1.2%, with a modest increase in small caps participating in the rally.
The Magnificent Seven and the S&P 500

The Magnificent Seven, comprising Apple, Microsoft, Nvidia, Amazon, Meta, Alphabet, and Tesla, are again the key drivers for the markets. While AI trends are helping the narratives for $META, $NVDA, and $MSFT, valuation compression and guidance remain concerns for these names and are impacting the mega-cap space in general. This group’s influence on the markets remains a concern for the S&P 500 and Nasdaq, as without broader sector support, upside is still dependent on these names stabilizing.
Drivers Behind the Market Move – Wednesday, February 25, 2026
As the markets in the United States and Europe continue to process the earnings catalysts, newly introduced trade measures, and policy-oriented communications stemming from the State of the Union address, positioning in the markets remains selective but not aggressive. As there are no major economic releases scheduled for today, the markets are being moved by forward-looking expectations, geopolitical risks, and valuation sensitivity in technology and international trade-exposed equities.
- Nvidia Earnings Announcement and AI Valuation Sensitivity
The primary driver of the markets today is the anticipation of Nvidia’s earnings announcement. As the markets experienced a relief rally in semiconductor and software stocks in the previous session, positioning in AI capital expenditures is being recalibrated today. As technology stocks are highly valued compared to other sectors in the markets, forward-looking guidance rather than earnings beats is crucial in sustaining the momentum in these stocks. As the technology sector in Europe is also exposed to the semiconductor supply chains and capital expenditures in the region, futures in Europe are also being moved in tandem with the United States markets.
2. Implementation of Global Tariffs
The 10% global tariff has introduced fresh uncertainty into the outlook for company margins and stability in the supply chain. The market has avoided a risk-off reaction for now; however, trade-sensitive sectors such as industrials and exporters in Europe remain susceptible to further escalation risk. Further indicators of legal maneuvering in response to the Supreme Court tariff decision have contributed to the complexity of market expectations for trade and its potential outcomes. Market futures have reflected gains as investors factor in the possibility of further changes or retaliatory measures; however, such outcomes have thus far been measured and not decisive.
3. Policy Messaging, Energy Narrative, and Macro Stability
Recent market messaging on the following has provided support for market stability and expectations of economic stabilization: cooling inflation at 2.4%, lower mortgage rates, drilling permits, and a record in LNG exports. This is positive for energy stocks and inflation expectations, which is constructive for risk assets in general. However, this has been tempered by messaging on tensions in the Middle East and repositioning in trade tensions. There is no significant data to be released today; however, yesterday’s improved consumer confidence remains a positive factor in market stability. The market is balancing the positive news on economic relief with concern about the ability of the government to implement its policies and the situation in the Middle East.
In summary, the market tone for today is influenced by a catalyst-driven market based on earnings expectations, trade policy changes, and macro narrative positioning. The markets in the United States and Europe will likely remain cautiously optimistic pending further evidence of earnings and trade outcomes.
Digesting Economic Data
The TRUMP Tweets and Its Implications
The recent spate of public statements surrounding the State of the Union speech appears to build a cohesive story around themes of security, economic stabilization, and resurgent nationalism. The emphasis placed on “law and order,” historic low crime rates, reduced border crossings, and the claim that nearly 3 million undocumented workers have left the country are all part of an effort to build a story around domestic stability. For the markets, it represents an effort to reduce political and social risk premiums. In general, when a government appears to have internal stability and institutional control, it is a positive signal to equity markets. This is because it suggests a more favorable environment for consumer spending, investment, and long-term economic planning. Of course, the markets will ultimately care little for rhetoric in the face of hard facts in the labor market and in government finances. One aspect of the speech is the energy policy announcements. The emphasis placed on “energy dominance,” record levels of LNG exports, increasing access to public lands, and approval of nearly 6,000 drilling permits sends a strong signal. From a market perspective, it supports the notion of long-run supply increases in the energy sector. This could have the effect of capping oil price ceilings while supporting energy stocks. In addition, the fall in gasoline prices and the decline in inflation to 2.4% are touted as successes. This could have the long-run effect of keeping inflation in check and reducing upward pressure on bond yields. This in turn could have a positive impact on risk assets.
The housing and affordability themes are also relevant in this context. The discussion of mortgage rates at the lowest level since 2022 and improvements in housing affordability over the last seven months suggests an attempt to highlight positive developments in rate-sensitive markets. If true and sustained, this could be beneficial for real estate markets and consequently for the broader construction, retail, and banking sectors. The key issue is whether these mortgage rate declines are due to structural disinflation or merely cyclical pressures related to the evolution of financial conditions.
Lastly, the geopolitical and trade discussion adds another level of intricacy to the narrative. The discussion of diplomacy with Iran being the first choice is juxtaposed with the unwillingness to rule out force in conjunction with the discussion of legal workarounds in reaction to the Supreme Court ruling on tariffs. The markets typically react to ambiguity rather than resolve, so any type of tariff negotiation or threat can increase the level of volatility in the markets related to commodities, currencies, and multinational corporations. The discussion of the “Golden Age” and the reset in the economy is an attempt to frame an optimistic narrative but does not change the fact that the markets will react to the actual alignment of fiscal discipline, trade stability, and inflation pressures with this narrative. The key implication is that the markets are in an environment that is trying to balance domestic optimism with concerns about trade and execution.
FHFA House Price Index Cools as Higher Rates Slow Housing Momentum
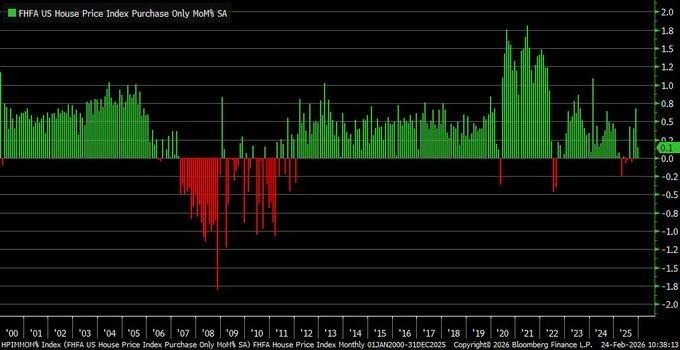
The FHFA House Price Index for December 2025 increased by merely 0.1%, which is below the expected increase of 0.3%. This increase is also slower than November’s rise of 0.7%. Although this represents an all-time high for this data set at 440.4, this also shows that the pace at which this appreciation is occurring is slowing down, with quarterly increases slowing to 0.8%. This reinforces that notion that higher mortgage rates are slowing down rather than causing prices to fall. The long-term trend for this data set shows that, after an extended period of strong appreciation, this appreciation is gradually slowing down, particularly after 2022.
What is significant to note is that this shows “softening, not cracking.” This means that slower appreciation means that speculative pressures and affordability are being alleviated, particularly for areas that are rate-sensitive. Although transaction volumes may be slowing down due to these higher mortgage rates, fundamentals are not cracking. This means that once mortgage rates ease up, transaction volumes may pick up before prices do. Therefore, at this juncture, I believe that D.R. Horton Inc. (DHI) is undervalued. This is because this is one of the largest homebuilders that benefits from economies of scale, discipline, and exposure to entry-level homes. This means that this company will be best positioned to take advantage of any increase in transaction volumes once mortgage rates ease up.
Analysts should be looking at mortgage applications, housing inventory turnover, and builder surveys to confirm that demand is indeed stabilizing. This means that credit availability and wage growth will be significant factors that will determine whether this slower appreciation will eventually lead to renewed appreciation or not.
Dallas Fed Services Index Falls into Negative Territory
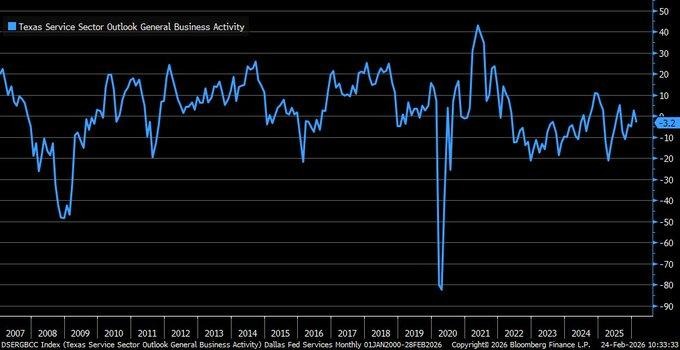
The Dallas Fed Services Index for February 2026 reported a drop to -3.2 from January’s reading of +2.7. This represents a significant drop in activity from expansion to contraction in Texas’ service sector. Since services contribute more than 70% to Texas’ economic output, this serves as an initial directional indicator of national momentum. Over the past several decades, similar dips in regional services surveys have preceded softness in national services purchasing manager surveys. This reading indicates demand is slowing down and prices are easing off. This is in line with the initial stages of disinflation.
Revenue and business optimism are slowing down but not collapsing. This is evident from the fact that employment indicators are slowing down and not contracting. This indicates that firms are becoming more cautious in their hiring strategies. This is in line with the late-stage economic cycle in which cost discipline becomes more important than expansion. In this context of the macroeconomic environment, Waste Management Inc. (WM) looks undervalued. This is because it is in the defensive services space and has the ability to maintain stable revenues and prices in an environment of slowing activity growth.
For analysts to gauge whether this is indeed the case, they must track the national services purchasing manager surveys, wage growth rates, and input prices. If services inflation cools off without significant deterioration in employment numbers, the prospects of policy easing later in the year might improve, providing support to defensive stocks. This might require recalibration of the current cyclicals. Until then, strategic allocation to essential service stocks might prove to be prudent.
Wholesale Inventories Steady as Sales Growth Narrows Supply Buffers
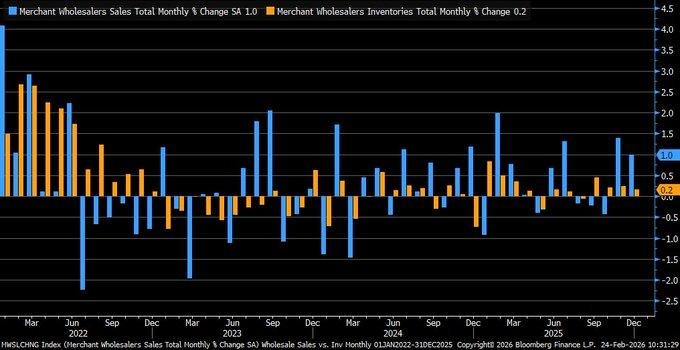
Wholesale inventories increased by 0.2% in December 2025 compared to the prior month, with sales growing by 1.0%. The sales growth has slowed down compared to the prior month’s 1.4%. The steady rise in wholesale inventories and the slowing down of sales growth are likely to result in a gradual increase in the inventory to sales ratio. When sales are growing at a much faster pace than inventory accumulation, the supply chain is operating at an optimal level. This would result in fewer discount-driven disinflationary pressures. On the other hand, the relatively lean inventory buffers would make the economy more prone to unexpected changes in sales trends, especially in cyclical products.
From an overall macroeconomic perspective, the relatively stable yet tightening inventory to sales ratio could be favorable for maintaining stability in production levels in the near term. If businesses are of the view that sales trends are sustainable, there is likely to be an uptick in the pace of inventory accumulation in the first quarter of 2026, which would result in an uptick in manufacturing production levels. On the other hand, if sales growth continues to weaken, the relatively lean inventory buffers would limit the downside risk of discount-driven disinflation pressures. From an investment perspective, FedEx Corporation (FDX) appears to be relatively undervalued compared to its peers. The company is likely to benefit from relatively stable goods-in-transit levels as well as efficiency-driven trends in distribution services.
From an analyst’s perspective, revisions to the wholesale trade data, durable goods orders, freight shipments would be an important indicator of the inventory cycle’s direction in the near term. Particular attention would be paid to pricing trends in distribution-heavy industries. The relatively stable yet tightening inventory to sales ratio would be an important indicator of whether the disinflationary pressures are sustainable without compromising growth momentum. However, if sales growth slows down sharply, the inventory dynamics would change relatively quickly. From an investment strategy perspective, disciplined investment in logistics platforms with scalable cost structures would remain strategically aligned with the current wholesale inventory trends.
Richmond Fed Manufacturing Contracts Further, Orders and Shipments Weaken
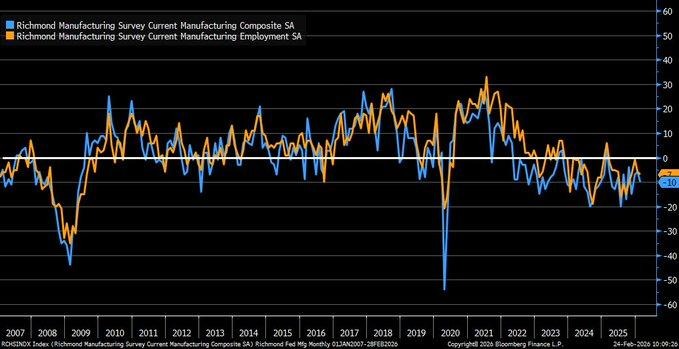
The February 2026 Richmond Fed Manufacturing Index fell to -10, missing forecasts of -5 and declining from January’s -6. The contraction accelerated across key components, with new orders falling to -9 from -6 and shipments declining sharply to -13 from -5. The acceleration of the decline in the Fifth Federal Reserve District’s main components signals that production’s positive trend is losing steam instead of stabilizing. Historically, such a decline in the regional Fed surveys has been followed by a decline in the U.S. national surveys one to two months later. The data confirms the assumption that the production sector is still struggling with weak demand and increasingly tight financial conditions.
The employment component continued to weaken to -7, indicating that labor demand is also losing steam alongside production. Although not alarming, this slowdown may eventually lead to a decrease in labor costs in the industrial sector. Labor cost moderation will reinforce disinflationary trends, supporting expectations of monetary policy flexibility in the second half of the year. Nevertheless, the resilience of services may offset recession risk, creating a divergence between the contraction in the production sector and the stability of services. In this context, we have identified Caterpillar Inc. (CAT) as a stock that appears to be undervalued. As a global leader in the production of heavy machinery with diversified exposure to the infrastructure and energy sectors, its strong order book and financial position will enable the company to cope with the current decline in regional Fed surveys.
Analysts should pay attention to the publication of national purchasing manager surveys for the U.S. manufacturing sector, durable goods orders, and capital expenditure guidance to confirm the direction of the cycle. They should also be aware of trends in order backlogs and price discipline among industrial machinery producers. In case of stabilizing contraction in the U.S. manufacturing sector and moderating labor costs, equity markets may anticipate better stability in profit margins before production recovers. For the time being, strategically investing in well-capitalized industrial leaders with diversified revenue streams across regions is still justified despite the decline in the Richmond Fed Manufacturing Index.
Consumer Confidence Rebounds, But Sentiment Still Cyclically Fragile
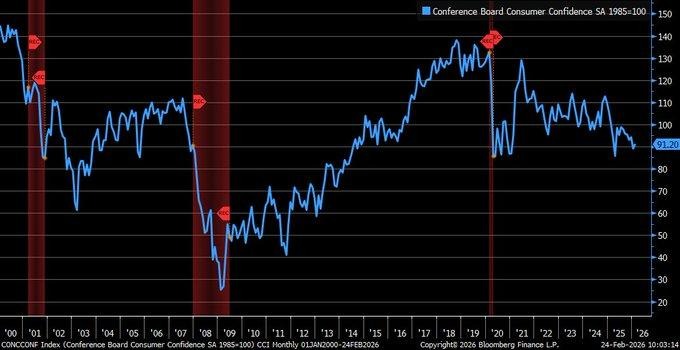
The Consumer Confidence Index increased by 2.2 points to 91.2 in February, beating expectations of 87.1 and rising from the revised January figure of 89.0. The increase was largely driven by the Expectations Index, which jumped 4.8 points to 72.0, indicating that consumers are less pessimistic about future business conditions and income growth. Conversely, the Present Situation Index fell by 1.8 points to 120.0, indicating that households believe labor and business conditions are weakening.
While consumer confidence is rising from its lowest levels, the fact that the current figure is still lower than every major recession peak prior to 2000 highlights that consumer sentiment is still fragile. Nevertheless, the increase in automobile and household appliance purchase intentions may be a positive sign that consumers are starting to become more optimistic about spending. In the context of the macroeconomic picture, we believe Home Depot Inc. (HD) is a good investment opportunity because its current share price is undervalued. As a leading retailer of home improvement products, the company will benefit from any increase in consumers’ intentions to purchase big-ticket items.
In summary, analysts should pay attention to future retail sales data, credit card delinquency rates, and real income to determine whether the improvement in consumer expectations will be followed by strong spending activity. As such, analysts should be aware that inflation expectations are still high and may affect consumer spending should real incomes decline. The improvement in consumer expectations without any negative trends in credit card delinquency rates will be a positive sign for consumer discretionary stocks. For now, investors should still allocate to consumer discretionary stocks with a focus on retailers with strong fundamentals.
ETF Flows Indicate Shift of Funds from US Large Caps to Global Markets
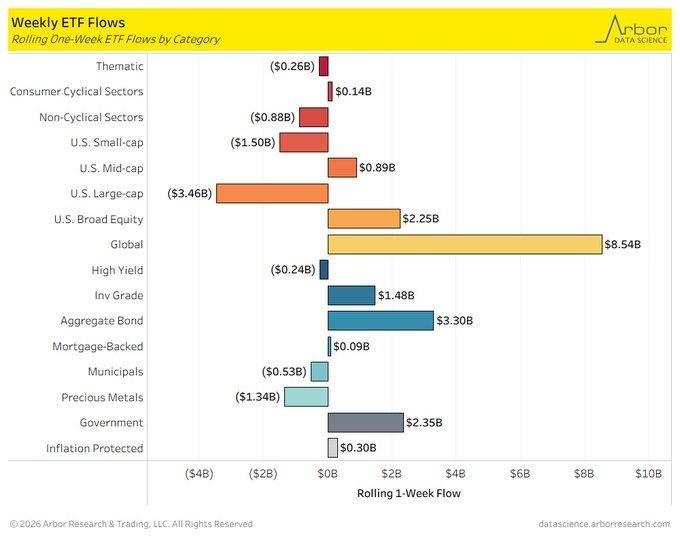
Current fund flows indicate that $8.54 billion has been invested in global ETFs over the past week, i.e., until February 20, 2026. On the other hand, US large caps have seen an outflow of $3.46 billion in ETFs over the same period. The cumulative inflows over the past six weeks have been above $250 billion. The outflow in US large caps indicates that investors are taking profits or diversifying their portfolios rather than being risk-averse. The outflow is also likely because of the shift of focus to other global investment opportunities.
The shift is not limited to a single week’s data because global ex-domestic large cap blend ETFs have seen inflows of $19.3 billion over the past month. The weak dollar story has also been contributing to this shift in focus towards global diversification because of the possibility of rate cuts in the future. Historically, such shifts have been seen when valuation spreads are widening and global earnings growth expectations are converging. From this context, BlackRock Inc. (BLK) appears to be an undervalued play because it is a global asset management company with diversified ETF businesses that are likely to benefit from the high levels of ETF flows seen over the past month or so. The valuation does not reflect the high level of earnings leverage that the company is likely to benefit from.
Analysts should keep an eye on currency trends, global earnings revisions, and valuation differentials between various geographies to confirm the sustainability of flows in diversified asset managers that have global operations to outperform domestic asset allocation strategies in the near term. Positioning in diversified asset managers with global operations would be strategically aligned with the current capital migration trends.
Chicago Fed National Activity Index Turns Positive, Growth Stabilizes
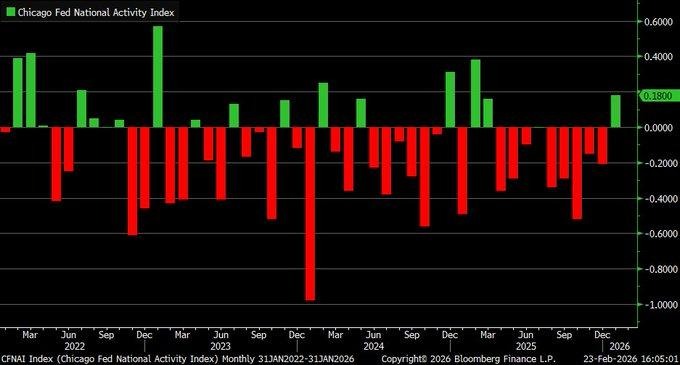
The Chicago Fed National Activity Index rose to +0.18 in January 2026 from -0.21 in December, ending five consecutive months of contractionary readings. As a composite measure built from 85 economic indicators, a reading above zero signals above-trend growth. The rebound was primarily driven by improvements in production (+0.19) and employment (+0.01), indicating that industrial activity and labor conditions contributed positively to overall momentum. While this shift suggests stabilization after late-2025 softness, the three-month moving average remains slightly negative at -0.06, underscoring that the recovery is still in its early stages rather than firmly established.
The improvement reduces immediate recession probability signals but does not yet confirm a durable acceleration. Sustained positive readings across multiple months would be required to reinforce confidence in broad-based expansion. The divergence between a positive headline and a still-negative moving average highlights an economy transitioning from slowdown to potential stabilization. Within this macro framework, we view Union Pacific Corporation (UNP) as relatively undervalued. As a major freight rail operator closely linked to industrial production and goods movement, the company stands to benefit from incremental production gains and stabilizing shipment volumes. Current valuation levels reflect prior cyclical concerns rather than a confirmed recovery in activity trends.
Analysts should monitor upcoming production data, freight shipment volumes, and regional business surveys to validate whether January’s rebound marks a turning point or a temporary fluctuation. Attention should also be paid to labor market consistency and capital expenditure signals. If growth indicators remain above trend in coming months, cyclical industrial and transport equities may re-rate higher. However, failure to sustain positive momentum would reinforce a prolonged mid-cycle pause. For now, selective exposure to infrastructure-linked transportation leaders with strong operating leverage remains strategically aligned with early stabilization signals.From an investment analysis perspective, it is important to note that the recent increase in the CFNAI to positive territory is an important indicator of stabilization in growth trends. As such, it is important to note that investors need to keep an eye on recent production trends and freight shipment volumes in the coming months to gauge whether the recent increase in the CFNAI to positive territory is a turning point in growth trends or simply a temporary increase in the CFNAI. Similarly, investors need to keep an eye on labor trends and capital expenditures in the coming months to gauge whether growth trends are sustained in positive territory in the coming months. If growth trends continue to be in positive territory in the coming months, then cyclical industrial and transportation stocks are likely to re-rate higher.
Equity Ownership Concentration Rises, Wealth Effect Becomes Narrower
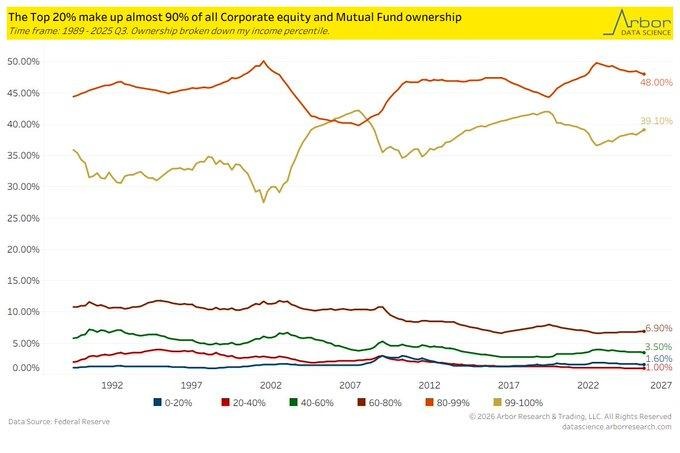
The latest data released by the Federal Reserve indicates that the top 20% of income earners owned 89.7% of corporate equities and mutual fund shares during Q3 2025, while the top 1% owned 39.1%. This represents an increase from around 82% concentration levels recorded in 1989, emphasizing the change that has occurred over the past few decades. The income brackets below this level collectively own fewer than 2% of equities, emphasizing the widening gap. From a macro perspective, this concentration increases dependency on the “wealth effect” on the performance of equities, focusing on a small segment of consumers rather than the entire population.
This process has important implications for consumption resilience and policy transmission. When gains are concentrated among higher cohorts of income earners, additional spending is channeled into asset reinvestment instead of direct consumption. Hence, equity rallies may provide less economic stimulus than experienced previously. Nevertheless, equity markets may experience higher volatility in the case of corrections because of the impact of portfolio reallocations among the higher cohorts of income earners. In the aforementioned structural context, we believe BlackRock Inc. (BLK) to be undervalued. The company is a diversified global asset manager with a wide distribution platform for its products. It benefits from sustained capital allocation by high net-worth individuals. Current valuation multiples fail to capture the long-run fee stability associated with participation rates of high net-worth individuals in financial markets.
Analysts should track trends in household net worth participation rates, retail trading participation rates, and asset allocation patterns across different income groups. Moreover, any change in fiscal policies or tax systems may impact the allocation of capital. With rising equity ownership concentration among households, financial platforms with scalable advisory models may experience strong inflows. Strategic investment positions in diversified financial infrastructure platforms are aligned with long-run trends in ownership concentration.
Upcoming Economic Events
No Major Releases Today, Attention Shifts to Remaining Week
Today’s economic calendar is relatively light, with no major high-impact releases scheduled. While this may reduce immediate volatility, it does not eliminate risk. In fact, quieter sessions often create a temporary pause in positioning as market participants wait for clearer signals. In this environment, price action can be driven more by sentiment shifts, technical levels, and positioning adjustments rather than fresh macro catalysts.
Investors should remain alert to the remaining data scheduled later this week. Key releases tied to inflation, employment, growth momentum, or consumer activity can quickly alter rate expectations and sector rotation trends. When markets consolidate ahead of data, it often reflects institutional caution rather than confidence. Any upside surprise later in the week could reinforce cyclical strength and push yields higher, while downside surprises may revive defensive flows into bonds and low-volatility equities.
From a positioning perspective, we view Johnson & Johnson (JNJ) as relatively undervalued within this cautious backdrop. As a defensive healthcare leader with stable cash flow and resilient demand characteristics, it provides balance during data-driven uncertainty. Analysts should monitor forward economic releases closely, particularly those influencing interest rate outlook, inflation trajectory, and consumer demand signals. Maintaining disciplined exposure and flexibility ahead of upcoming macro catalysts remains essential.
Stock Market Performance
Major Indexes Rebound From Lows, But Internal Drawdowns Remain Deep
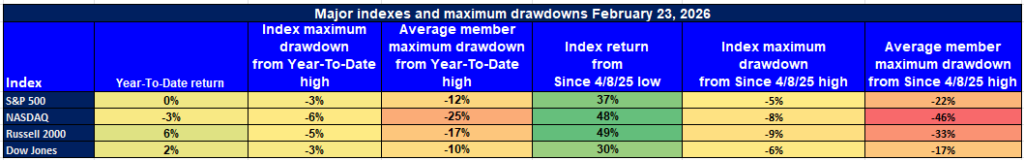
Equity benchmarks have staged a meaningful recovery since the April 8, 2025 low, yet year-to-date returns and internal drawdowns tell a more cautious story. While headline index performance appears stable to positive in select cases, the average member drawdowns reveal significantly deeper stress beneath the surface. This divergence suggests that leadership remains concentrated and market breadth continues to lag.
Here is our breakdown based strictly on the latest figures:
S&P 500: Flat Year, Strong Rebound, Narrow Participation
YTD: 0% | +37% since 4/8/25 low | -3% max drawdown from YTD high | Avg. member: -12% YTD high drawdown | -22% avg. member drawdown since 4/8/25
The S&P 500 is flat year-to-date but has rebounded 37% from the April low. The index itself has experienced only a 3% maximum drawdown from its YTD high. However, the average constituent tells a different story, with a 12% maximum drawdown from YTD highs and a 22% average member drawdown since the April low. This indicates headline resilience masking deeper underlying volatility.
NASDAQ: Strongest Rebound, Sharpest Internal Damage
YTD: -3% | +48% since 4/8/25 low | -6% max drawdown from YTD high | Avg. member: -25% YTD high drawdown | -46% avg. member drawdown since 4/8/25
The NASDAQ shows the strongest rebound at 48% off the April low, yet remains down 3% year-to-date. While the index drawdown from YTD highs is limited to 6%, the average member has fallen 25% from its YTD high and 46% since the April low. This reflects significant dispersion within growth equities.
Russell 2000: Positive YTD, Volatile Participation
YTD: +6% | +49% since 4/8/25 low | -5% max drawdown from YTD high | Avg. member: -17% YTD high drawdown | -33% avg. member drawdown since 4/8/25
The Russell 2000 leads on a YTD basis with a 6% gain and a 49% rebound from the April low. However, average member drawdowns remain elevated at 17% from YTD highs and 33% since the April trough, highlighting uneven recovery within small-cap stocks.
Dow Jones: Modest Gains, Relative Stability
YTD: +2% | +30% since 4/8/25 low | -3% max drawdown from YTD high | Avg. member: -10% YTD high drawdown | -17% avg. member drawdown since 4/8/25
The Dow Jones has gained 2% year-to-date and 30% since the April low. With only a 3% drawdown from YTD highs and comparatively smaller average member declines, it reflects relative defensive stability compared to broader growth segments.
At Zaye Capital Markets, we remain focused on participation metrics rather than headline index levels. While rebounds from the April low are significant, average member drawdowns indicate that structural fragility persists. We continue to prioritize balance sheet strength, earnings durability, and sector diversification while closely monitoring breadth confirmation before adopting a more aggressive risk stance.
The Strongest Sector In All These Indices
Energy Leads Across the Board, Defensive Rotation Expands
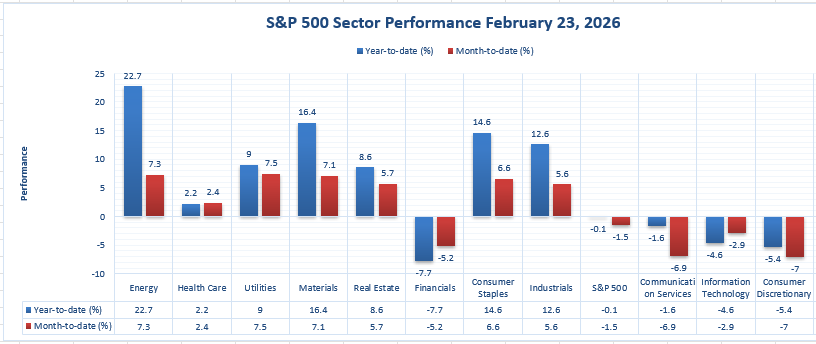
The data on sector performance makes it very obvious that Energy is the strongest sector in the entire S&P 500 universe. In fact, Energy has led the charge over the past year, rising by +22.7%. Not only has Energy outperformed every other sector over the past year, but it has also outperformed every other sector over the most recent month, rising by +7.3%. No other sector on this chart has achieved this level of performance over the past year or over the most recent month.
The next strongest sector is actually the Materials sector, which has risen by +16.4% over the past year and +7.1% over the most recent month. The Consumer Staples sector is actually the next strongest sector, having risen by +14.6% over the past year and +6.6% over the most recent month. The Industrials sector is actually holding up relatively well, having risen by +12.6% over the past year and +5.6% over the most recent month. The Utilities sector is holding up relatively well too, having risen by +9.0% over the past year and +7.5% over the most recent month. However, none of these sectors have outperformed the +22.7% gain in the Energy sector over the past year. In fact, the Real Estate sector, which has risen by +8.6% over the past year and +5.7% over the most recent month, is actually lagging significantly behind the Energy sector.
On the flip side, the Financial sector, which has declined by -7.7% over the past year and by -5.2% over the most recent month, remains weak, as does the Communication Services sector, which has declined by -1.6% over the past year and by -6.9% over the most recent month, as does the Information Technology sector, which has declined by -4.6% over the past year and by -2.9% over the most recent month, as does the Consumer Discretionary sector, which has declined by -5.4% over the past year and by -7.0% over the most recent month. The S&P 500 itself has declined by -0.1% over the past year and by -1.5% over the most recent month.
From our perspective at Zaye Capital Markets, Energy’s +22.7% year-to-date gain and +7.3% monthly advance confirm it as the strongest sector across the index structure. The combination of sustained momentum and broad relative outperformance signals continued capital rotation into commodity-linked and cash-flow-generative industries. While sector leadership can evolve, current data clearly positions Energy as the dominant force within the present market framework.
Earnings
Earnings Recap – February 24, 2026 (Yesterday)
- Home Depot, Inc. — Fiscal Q4 2025 and Full Fiscal 2025 reported Q4 sales of $38.2 billion (-3.8% YoY), impacted by the prior-year extra week. Q4 net earnings totaled $2.6 billion, or $2.58 per diluted share, down from $3.0 billion ($3.02) last year. Adjusted diluted EPS was $2.72 versus $3.13 YoY. Full-year sales reached $164.7 billion (+3.2%), with net earnings of $14.2 billion ($14.23 per share). Adjusted full-year EPS was $14.69 versus $15.24. Comparable sales rose 0.3%. The dividend increased 1.3%. FY2026 guidance calls for sales growth of 2.5%–4.5% and adjusted EPS flat to +4%.
- HP Inc. — Fiscal Q1 2026 delivered revenue of $14.4 billion (+6.9% YoY; +5.2% constant currency). GAAP net earnings were $545 million, or $0.58 per share (vs. $0.59 YoY). Non-GAAP EPS was $0.81 (+9.5% YoY from $0.74). Non-GAAP adjustments totaled approximately $208 million after tax ($0.23 per share). Growth was driven by Personal Systems and AI PC demand. FY2026 non-GAAP EPS guidance stands at $2.90–$3.20, trending toward the lower end.
- NRG Energy, Inc. — Full Year 2025 and Q4 2025 reported full-year GAAP net income of $864 million ($4.09 per share). Adjusted net income reached $1.606 billion, with adjusted EPS of $8.24 (+21% YoY from $6.83). Adjusted EBITDA was $4.087 billion (vs. $3.789 billion YoY). Free cash flow before growth equated to approximately $11.63 per share. 2026 adjusted EPS guidance is $7.90–$9.90 (midpoint $8.90), with adjusted EBITDA projected at $5.325–$5.825 billion.
- Cipher Mining Inc. — Q4 and Full Year 2025 recorded Q4 revenue of $60 million. GAAP net loss totaled $734 million, largely non-cash (derivative and impairment items). Year-end liquidity was approximately $754 million ($628 million cash + $125 million other). The company is pivoting toward hyperscale/HPC data centers with ~600 MW leased capacity and approximately $9.3 billion contracted revenue potential. Further Bitcoin mining revenue decline is expected during transition.
- American Tower Corporation — Q4 and Full Year 2025 reported Q4 total revenue of $2.738 billion (+7.5% YoY) and Q4 property revenue of $2.673 billion (+7.6%). Full-year total revenue reached $10.645 billion (+5.1%), with net income of $2.629 billion (+15.3%). Adjusted EBITDA approximated $7.130 billion. AFFO attributable to common stockholders was ~$5.042 billion (+8.2%). 2026 AFFO per share guidance is $10.78–$10.95.
- Standard Chartered PLC — Full Year 2025 delivered operating income of $20.9 billion (+6% YoY; +8% ex-notables constant currency). Net interest income was $11.2 billion (+1%), while non-NII rose 13% to $9.7 billion. Underlying profit before tax reached $7.9 billion (+18%). Reported PBT was approximately $7.0 billion. Underlying EPS was 229.7 cents (+37%); reported EPS 195.4 cents (+38%). Underlying RoTE improved to 14.7%. Dividend rose 65% to 61 cents, and a $1.5 billion buyback was announced. 2026 guidance calls for income growth at the bottom of the 5%–7% range and statutory RoTE above 12%.
Earnings – February 25, 2026 (Today)
- NVIDIA Corporation — Investors should focus on data center revenue growth scale, gross margin trajectory, AI infrastructure demand visibility, and forward revenue guidance sensitivity, as these will determine whether current AI-driven capital expenditure trends remain sustainable.
- TKO Group Holdings, Inc. Class A — Key metrics to monitor include media rights revenue growth, operating margin expansion, event monetization efficiency, and free cash flow conversion strength.
- IonQ, Inc. — Revenue growth rate, commercial contract pipeline development, operating expense discipline, and cash runway sustainability will be critical indicators for quantum commercialization progress.
- HEICO Corporation Class A — Aerospace aftermarket sales growth, backlog expansion, operating margin stability, and acquisition integration performance remain primary focus areas.
- TJX Companies Inc. — Comparable sales performance, gross margin resilience, inventory turnover efficiency, and forward consumer demand guidance will shape discretionary outlook interpretation.
- Manchester United Plc Class A — Commercial revenue trends, broadcasting income consistency, wage cost ratio control, and debt profile stability will guide investor assessment of earnings durability.
Stock Market Overview – Wednesday, 25 Feb 2026
The US stock market is currently showing a cautious constructive bias. The market is responding to a plethora of artificial intelligence-related corporate announcements, earnings revisions, and macro uncertainties. The broad stock market indices are stabilizing. However, the leading stocks are showing relative strength. The artificial intelligence infrastructure space continues to dominate the market. The geopolitical tensions and fiscal uncertainties continue to keep the market volatile. We at Zaye Capital Markets continue to track the breadth expansion and earnings strength before calling a breakout phase.
Stock Prices
Economic Indicators and Geopolitical Developments
The market sentiment is influenced by a combination of improving consumer sentiment and macro uncertainties. The recent consumer sentiment data has reduced recession concerns. However, geopolitical tensions and fiscal uncertainties continue to affect cross-asset classes. The geopolitical tensions and changing supply chains continue to dominate the market. The US Treasury yields have been steady. The yields are high enough to keep the market sensitive.
Latest Stock News
The artificial intelligence infrastructure and capital expenditures continue to dominate the market. $META has pledged $100 billion over five years for $AMD alongside 6 GW of artificial intelligence compute. The pledge embeds AMD into Meta’s long-term infrastructure and addresses scalability concerns. AMD is now part of two largest artificial intelligence infrastructure builds globally. $META also plans to relaunch stablecoin payments in 2H2026 with a new digital wallet.
$GOOGL is expanding its U.S. data centers in Texas and Minnesota, and scaling Waymo services in Dallas, Houston, San Antonio, and Orlando. $AAPL will manufacture Mac mini products in Houston in 2026 and will buy over 100M chips from $TSM’s Arizona facility, a positive for domestic semiconductor plays.
$IREN is converting its BC sites to GPUs and advancing its Sweetwater 1.4GW interconnection, shifting focus to AI compute monetization. $CRWV is reportedly seeking a $9B loan based on its compute deal with $META.
Enterprise AI usage continues to accelerate with the expansion of Claude Cowork integrations with Anthropic, $MSFT partnering with Starlink for rural connectivity, and $JPM using LLM internally for 150K employees. Meanwhile, $STRIPE is reportedly considering a deal for $PYPL, $ZETA is guiding 40% growth in Q1 with profitability, and $AXON added $3B in contracted bookings in a single quarter.
The Magnificent Seven and the S&P 500
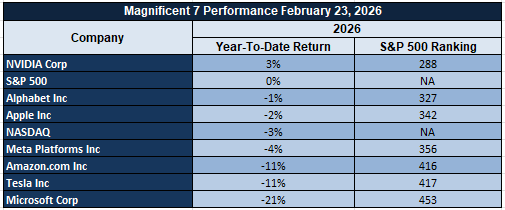
The Magnificent Seven, comprising Apple, Microsoft, Nvidia, Amazon, Meta, Alphabet, and Tesla, are again the key drivers for the markets. While AI trends are helping the narratives for $META, $NVDA, and $MSFT, valuation compression and guidance remain concerns for these names and are impacting the mega-cap space in general. This group’s influence on the markets remains a concern for the S&P 500 and Nasdaq, as without broader sector support, upside is still dependent on these names stabilizing.
Major Index Performance as of Wednesday, 25 Feb 2026
- NASDAQ: Trading near 22,864, up +1.0%, with a tech rebound in select names driving the Nasdaq.
- S&P 500: Trading near 6,890, up +0.8%, with a moderate improvement in breadth.
- Dow Jones Industrial Average: Trading near 49,175, up +0.8%, with industrial and defensives leading the Dow.
- Russell 2000: Trading near 2,653, up +1.2%, with a modest increase in small caps participating in the rally.
We at Zaye Capital Markets believe this is a selective risk-on rather than a broad-based conviction environment. While the AI infrastructure space remains the capital magnet, valuation discipline and macro sensitivity continue to guide near-term trading action. We believe investors should focus on balance sheet health and cash flows with sustainable sector trends from capex-sensitive industries
Gold Price: Why is Gold Trading Above $5,100 as Policy and Tariff Indicators Weigh?
Currently, spot gold is trading around $5,181.95 per ounce, and futures are trading around $5,200 levels as gold is holding firmly above the $5,100 levels as markets digest the policy-heavy indicators and trade-related announcements emanating from the White House. The latest announcements by the White House on falling inflation levels, lower mortgage rates, energy dominance, expansion of drilling permits, and record LNG exports provide a boost to market confidence levels and therefore reduce the demand for gold as a safe-haven asset. However, announcements on possible tariff circumvention and tensions with Iran provide a counterweight to market confidence levels and therefore keep gold in the spotlight as a counterweight against possible volatility in the currency and other risk assets as long as the direction of the tariff is ambiguous and the rhetoric on trade is assertive in nature.
As far as yesterday’s economic indicators are concerned, the overall sentiment was provided support by better-than-expected consumer confidence levels, which generally support equity markets and result in lower demand for gold as a safe-haven asset. However, inflation levels remaining close to 2.4% and falling mortgage rates provide evidence of a transition in the overall policy environment and therefore keep gold in the spotlight as a counterweight against possible volatility in the overall market environment as long as the overall direction of the economy is ambiguous in nature. In such a situation, real yields become a major factor for investors as the overall direction of inflation remains firm and the overall direction of the economy is ambiguous in nature. Therefore, as there is no major economic indicator being released in the market today, gold price is being determined by overall policy and trade indicators emanating from the White House and the overall direction of the tariff and trade in the overall market environment.
Oil Prices: What’s Behind Rising Oil Prices Due to Energy Policies and Global Geopolitical Tensions?
Brent crude is trading near $71.20 per barrel as it holds near multi-month highs, with WTI crude trading near $66.01 per barrel as it also holds near multi-month highs. Recent price increases are due to a rising geopolitical premium due to diplomatic tensions in the Middle East, leading to rising hedging demand in oil futures markets. Meanwhile, U.S. inventory levels saw increases in crude oil inventories, which normally would weigh on prices, but the market has digested this news due to rising geopolitical tensions in the region. Commentary on rising domestic drilling permits, record U.S. exports, and America’s “energy dominance” adds a counterbalance to rising oil prices due to rising long-term oil supply, which normally would weigh on rising oil prices. However, simultaneous commentary on rising diplomatic tensions and the possibility of using force adds volatility, especially in areas where global oil supplies are threatened. There are no economic data points to focus on today, and oil prices are driven by positioning, geopolitical events, and OPEC production discipline and IEA demand projections.
The latest round of economic data from yesterday shows positive consumer sentiment and a decline in inflationary pressures. The demand is steady and not contracting. Therefore, there is a floor in crude prices. The decline in mortgage rates and signs of economic relief imply that the chances of a recession are not rising. Therefore, there is no increase in the risk of a decline in demand. The growth rate is steady. Therefore, there is no room for crude prices to go higher unless demand growth picks up. The OPEC strategy of controlling supplies is helping crude prices. The projections by the IEA about balanced growth in supplies up to 2026 are helping crude prices from going higher than this level. The crude prices are in a range. The range is due to tensions. The tensions are due to diplomatic efforts. The tensions are also due to security concerns. The crude prices are being influenced by inventory levels. The crude prices are being influenced by supplies. The crude prices are in a range due to geopolitical tensions. The crude prices are being influenced by diplomatic tensions. The crude prices are being influenced by security concerns. The crude prices are being influenced by inventory levels. The crude prices are being influenced by supplies. The crude prices are being influenced by geopolitical tensions. The crude prices are being influenced by diplomatic tensions. The crude prices are being influenced by security concerns. The crude prices are being influenced by inventory levels. The crude prices are being influenced by supplies.
Bitcoin Prices: Why Is Bitcoin Trading in the Mid-$60,000 Range Amid Policy Uncertainty and Global Risk-Off Sentiment?
Currently, Bitcoin is trading in the mid-$60,000 range. It has been fluctuating in the range of $63,000 and $65,000. Recently, it reclaimed the $64,000 level during the U.S. session. However, it later encountered selling pressure. In the last 24 hours, Bitcoin has declined by a mid-single-digit percentage. The decline can be attributed to weakness in the crypto market due to risk-off sentiment globally. The risk-off sentiment is due to uncertainty in the global economy. Currently, Bitcoin dominance is high. Therefore, it shows that investors are accumulating Bitcoin instead of exiting the crypto market. The current range of Bitcoin can be attributed to the combination of risk sentiment and demand from investors. The demand from investors is due to the positive sentiment of Bitcoin as a store of value. The recent policy commentary on the economy has been positive. It highlighted the economy as strong.
Additionally, it stated that inflation is decreasing by 2.4%. Furthermore, it stated that mortgage rates have fallen. The narrative on energy dominance is also positive. The positive sentiment from the above factors should have been reflected in Bitcoin prices. However, the recent commentary on working around tariffs, geopolitical tensions with Iran, and uncertainties regarding trade have made investors cautious. Yesterday, the U.S. economy saw improved consumer confidence. It led to stability in the economy. However, it did not have a significant impact on Bitcoin prices. Today, there are no significant events in the U.S. economy. Therefore, Bitcoin prices can be influenced by factors other than the economy. The factors include risk sentiment, geopolitical tensions, and technical factors. In the current scenario, Bitcoin is range-bound. It is influenced by changes in global liquidity expectations and geopolitical tensions.
ETH Prices: Why Ethereum Prices Are Trading Around $1,900 Amid Trends of ETF Outflows and Whale Accumulation?
Presently, Ethereum is trading around $1,900 for every ETH. The Ethereum price has been fluctuating within a certain range of $1,900 and $1,925. The cryptocurrency has been consolidating following recent price movements that saw Ethereum trade within the support zone of $1,800. The cryptocurrency sector has experienced pressure from a risk-off environment. Ethereum has also not escaped the recent pressure. The Ethereum price has shown signs of vulnerability in recent times. Recent trends have indicated that Ethereum exchange-traded funds have seen a decline in trading within the United States. The decline has seen about $405 million in Ethereum exchange-traded funds since mid-February. The trends are important for Ethereum because they determine the level of exchange traded funds’ influence on Ethereum. The Ethereum price has shown resilience in holding above support levels. The resilience indicates that Ethereum has seen positive sentiments from participants in the sector.
On the other hand, on-chain metrics reveal a notable whale accumulation trend, with these large entities reportedly accumulating 130,000 ETH, valued at over $250 million, during the recent weakness in the market. This trend can be considered a bullish counterbalance to the prevailing bearish trend, with these long-term holders potentially viewing the current price levels as a “value zone” compared to the recent cycle highs. However, yesterday’s economic indicators, reflecting a rise in consumer confidence and a subsequent easing in inflation rates, provided a minor boost to the overall economic sentiments but failed to spark a notable cryptocurrency price rally due to prevailing macro-economic and geopolitical factors. In the absence of economic indicators affecting the cryptocurrency markets today, Ethereum price is largely driven by the prevailing trends in ETF flows and whale wallet accumulation patterns rather than fresh economic inputs. The asset is technically trading in a range, awaiting fresh inflows from institutional investors to spark a price rally or a break in support levels to spark a negative price correction.
