Market Today
Equity stock futures in the United States and Europe are trading flat to slightly mixed heading into the opening bell today as the market continues to consolidate and wait on important data and a major Supreme Court ruling on tariff powers. The S&P 500 stock index futures are rising slightly, the Nasdaq 100 stock index futures are also slightly higher, and the Dow Jones stock index futures are only slightly higher as well, while the major European stock index futures such as the DAX and CAC 40 are slightly lower in the premarket. The overall theme of the market is one of risk management and waiting on important data and news rather than aggressive buying or selling.
One of the most important influences on futures positioning at the present time has been the anticipation of the release of important U.S. data that can significantly impact growth and monetary policy. The advance release of the Gross Domestic Product (GDP) for the fourth quarter of the year, in which economists are anticipating a 2.5% annualized increase, a deceleration from the prior quarter’s robust 4.4% increase, will be released. Additionally, the Core Personal Consumption Expenditure (PCE) Price Index, the Fed’s preferred inflation measure, will be released, in which a 3.0% year-over-year increase in prices is anticipated, still above the 2% level that the central bank seeks to maintain. Traders will be assessing the impact of a potentially slower rate of growth and still-elevated inflation on the potential timing of rate cuts, which will impact risk valuations and discount rates. A softer GDP release and diminishing inflation pressures will be positive for risk, while a robust release will be negative.
European futures have been impacted by a variety of macroeconomic uncertainties, as well as exposure to European economic data releases. The mixed corporate earnings, uneven industrial activity, and weakening economic data out of the Eurozone have contributed to a cautious pre-market session. As global manufacturing activity and service sector data have been mixed, European markets are sensitive to the impact of U.S. economic data releases and currency movements. A stronger dollar in response to a robust GDP and inflation report will be negative for export-oriented European companies, while a weakening dollar in response to a softer U.S. economic report will be viewed as a positive. The impact of U.S. macroeconomic data releases on European economic conditions has been the reason for the lack of a strong directional bias in European futures.
Another area of uncertainty that contributes to the flat futures scenario is the geo-political risks and policy announcements. Escalating tensions between the U.S. and Iran, along with the potential Supreme Court verdict on trade powers, has resulted in the addition of a risk factor to the overall pricing of assets. It has been observed that the overall market consensus expects a favorable verdict to be passed in support of stocks in case the tariffs are ruled out, even if alternative trade agreements come into effect. At the same time, the developments in the overall trade diplomacy scenario, including landmark agreements to eliminate tariffs, enhance the scope of digital trade, and strategic cooperation in the field of resources with Indonesia, have resulted in the addition of structural shifts to the overall market scenario.
Major Index Performance as of Friday, 20 Feb 2026
- S&P 500: Currently trading at 6,874.45. This reflects the moderate downward pressure seen in the market as a result of the mega-cap valuation rebalancing.
- Nasdaq Composite: Currently trading at 22,682.73. This reflects the volatility seen in the AI/technology stocks as a result of the rate sensitivity.
- Dow Jones Industrial Average: Currently trading at 49,451.53. This reflects the support seen in the industrial and energy sectors as a result of the overall macro cautions.
- Russell 2000: Currently trading at 2,661.25. This reflects the relative strength seen in the small-cap sectors.
The Magnificent Seven and the S&P 500

The Magnificent Seven, comprising Apple, Microsoft, Nvidia, Amazon, Meta, Alphabet, and Tesla, continue to dominate index performance. In recent weeks, these groups have faced further pressure as investors review AI monetization, capital expenditure, and earnings sustainability. The structural stories remain positive, but short-term multiple compression and profit-taking have restricted upside movement in the S&P 500 and Nasdaq Composite indices. There has been further evidence of non-mega-cap S&P 500 constituents delivering stronger performance, indicating internal strength rather than weakness. The strength of the market rests on the ability of these groups to break out beyond their exposure to technology.
Drivers Behind the Market Move – Friday, February 20, 2026
With the U.S. and European markets trading in a cautious and data-sensitive fashion, the investor positioning today reflects a blend of high-impact economic data, trade diplomacy, and geopolitical tensions. The futures for the U.S. and Europe reflect a cautious tone rather than a strong conviction, as investors balance growth momentum and inflation persistence while also considering fresh trade and security announcements emanating from the U.S.
- Landmark Indonesia Trade Agreement and Strategic Resource Alignment
A major market influence today revolves around the newly announced trade agreement with Indonesia, characterized as a landmark deal that involves the elimination of tariffs for products amounting to over 99%, the enhancement of digital trade access, the removal of non-tariff barriers, and the elimination of restrictions on the exports of critical minerals. Commercial agreements amount to $33 billion, with $15 billion in energy agreements, $13.5 billion in aviation agreements, and over $4.5 billion in agricultural agreements. At the same time, a 19% reciprocal tariff rate on Indonesian imports will remain in place, ensuring a certain level of trade leverage. This combination of trade agreements and the retention of a certain level of tariff authority over Indonesian imports is significantly impacting industrial, energy, material, and mining stocks, particularly with the announcement of the memorandum for the extension of Grasberg operations.
2. Geopolitical Uncertainty and Middle East Developments
Another factor that is affecting cross-asset classes is geopolitical risk. The statements that the final decision on the potential Iran deal could be made in 10 days, as well as the plans to establish an international stabilization force that could comprise as many as 20,000 troops and train 12,000 police, are all affecting the geopolitical risk premiums. The additional steps to rebuild Gaza, which included the $10 billion U.S. contribution as well as funding from multiple nations, further underscore the rising level of global involvement in the region. These factors are all contributing to rising oil prices and defensive sector rotation, particularly with energy and defense-related equities. The European markets, which are sensitive to energy flows, are reacting cautiously to these rising oil prices.
3. Advance GDP, Core PCE, and Rate Path Expectations
The most immediate macro driver that is affecting markets currently is the Advance GDP and Core PCE Inflation figures that are to be released later today. The consensus that economists are expecting fourth-quarter growth to come in around 2.5%, which would represent a slowing down of growth from 4.4% previously, as well as Core PCE Inflation to come in around 3% year-over-year, which would still be above the 2% level that the Federal Reserve targets, is affecting interest rate path expectations based on how these figures come in. A weaker-than-expected reading on these figures could help to boost equity valuations as it would ease pressures on real yields. A stronger-than-expected reading on these figures could further reinforce the higher-for-longer rate narrative, which could particularly hurt technology-heavy indices in both the U.S. and Europe. The anticipation of these figures has resulted in restrained trading volumes as well as measured futures movement.
In summary, it can be noted that currently, markets are being impacted by structured trade recalibration with Indonesia, rising geopolitical risks that are signaled by events taking place in the Middle East, as well as critical inflation and growth figures that are to be released later today and that would determine interest rate path expectations. The interplay of these factors, as opposed to any single event, has resulted in the cautious and mixed market positioning that has been noted across U.S. and European markets.
Digesting Economic Data
The TRUMP Tweets and Their Implications
The latest series of tweets by the president revolve around a historic trade deal with Indonesia, which has been characterized as a significant restructuring of trade relations. The Indonesian side has agreed to remove tariffs on products exceeding 99 percent, address non-tariff trade barriers, eliminate import licensing restrictions on food and agriculture products, improve digital trade access, and remove restrictions on critical mineral exports. The trade deals are expected to reach $33 billion, with $15 billion worth of energy purchases, $13.5 billion worth of aviation deals, and more than $4.5 billion worth of agriculture purchases. In contrast, the US has agreed to maintain a 19 percent reciprocal tariff rate on Indonesian imports, with limited zero percent tariffs on textile and apparel products. The trade deal has significant implications for markets, as it reflects trade liberalization rather than normalizing tariffs.
The trade deal also involves Indonesia agreeing to join the Global Forum on Steel Excess Capacity and extending operations at the Grasberg mine through a Freeport-McMoRan memorandum. These factors are expected to positively affect energy, materials, and infrastructure equities, as they are critical to supply security. The energy purchase deals are expected to positively affect energy equities, as they enhance energy demand. The aviation and agriculture deals also positively affect export-oriented equities. However, the reciprocal tariffs may maintain trade tensions, which could continue to affect currency flows and pricing power.
In addition, geopolitical messaging was also prominent in the form of comments on the Gaza reconstruction project and a possible Iran deal in ten days. Some of the commitments made include a $10 billion contribution to the Board of Peace by the US, additional funding from the United Nations, international stabilization forces possibly training 12,000 police officers and deploying up to 20,000 troops, where Indonesia may also contribute to these troops. For the financial markets, these signals imply an increase in geopolitical risk premiums while also indicating a multilateral approach. This can be beneficial to the defense sector, the energy sector, while also being positive for safe-haven assets such as commodities.
Domestically, the messaging included gas prices being lower and tax savings for citizens. This indicates a pro-consumer approach in the context of geopolitical commitments. Symbolic messaging includes commemorating the 81st anniversary of the Battle of Iwo Jima, where 27 Medals of Honor are being awarded. This indicates a sense of history in the context of current events. From a financial markets point of view, the messaging indicates a combination of trade expansion, strategic resource alignment, and geopolitical stabilization. This indicates a recalibration of global economic positioning.
Labor Market Stability Indicates Controlled Economic Momentum
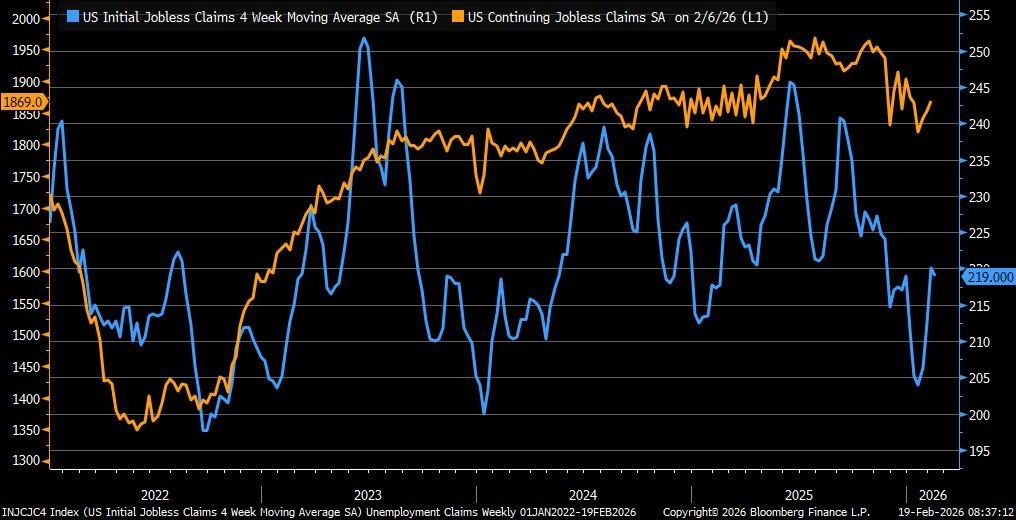
Initial unemployment claims have fallen to 206,000 as of the week ending February 13, 2026. The number is 23,000 lower than the previous week and significantly beats economists’ forecasts of 225,000. According to Zaye Capital Markets, the decline in initial unemployment claims indicates that large-scale layoffs are limited in scope and that business restructuring pressures are not expanding to larger industries. Initial unemployment claims that have been trending in the 200,000s have historically indicated a stable labor market in which employers are keeping their workers despite rising costs. The data therefore suggests that underlying economic demand remains strong and that the labor market continues to be a stabilizing influence on the broader economy.
Continuing unemployment claims rose to 1.869 million, well above economists’ forecasts of 1.860 million. The increase in continuing unemployment claims therefore suggests that while the number of people losing their jobs is falling, the unemployment duration is rising for the remaining unemployed. The rising continuing unemployment claims therefore indicate a labor market that is stable but not improving or accelerating. Hiring is therefore stable but not improving or accelerating as employers maintain tight control over their workforces.
Against this background, we believe that The Home Depot Inc. (HD) is an undervalued consumer discretionary play. A stable labor market therefore tends to sustain renovation activity and housing-related expenditures and investment in property upgrades and improvements. As wage income remains strong and layoffs remain subdued, demand for home improvement products therefore tends to sustain itself even in a moderate hiring environment. Analysts should therefore monitor wage income trends, consumer credit availability, housing turnover rates, and retail sales momentum to gauge whether labor market stability is translating into sustained consumer spending strength in cyclical industries.
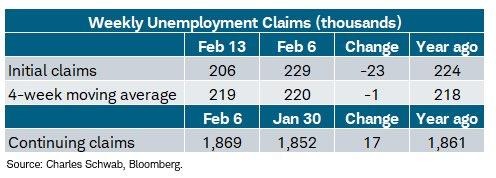
Pending Home Sales Hit Record Low
The Pending Home Sales Index fell to 70.9 in January 2026, a decrease of 0.8% from the previous month, and a record low in data going back to 2001. At Zaye Capital Markets, this is a key indicator that home demand is still structurally weak rather than merely soft. Mortgage rates remaining above 6.5% and home prices rising 4.2% on a year-over-year basis continue to pressure home affordability, thereby limiting home transaction volumes. As a forward indicator of existing home closings, this Pending Home Sales Index decrease indicates a decrease in home transaction volumes in the coming months, reinforcing our view that housing remains a headwind to overall economic growth.
With home financing costs high, buyers’ purchasing power is being compressed, particularly for first-time homebuyers. Meanwhile, existing home owners continue to benefit from lower home loan rates and are reluctant to sell their homes. This limits home inventory and supply, but still not enough to stimulate home transaction volumes. If this persists, home economists estimate a 5 to 7 percent decline in existing home sales on a year-over-year basis. We view this as a necessary home market correction rather than a home market collapse, with home affordability being the key driver rather than a decline in home demand.
In this environment, we view Lowe’s Companies, Inc. (LOW) as a value stock compared to home market pessimism. As home transaction volumes slow, home renovation/remodeling activities offset this to a degree as home owners opt to renovate and improve their current homes rather than transacting to a new home. Analysts should look to track trends in home mortgage rates, housing starts, building permits, and retail home improvement sales to gauge whether home renovation activities stabilize home earnings growth.
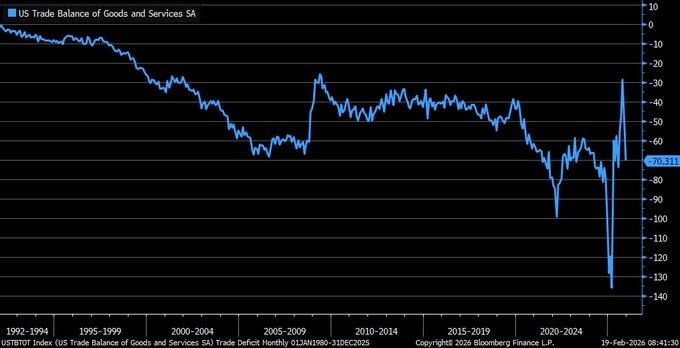
Trade Deficit Stays Near Historic High
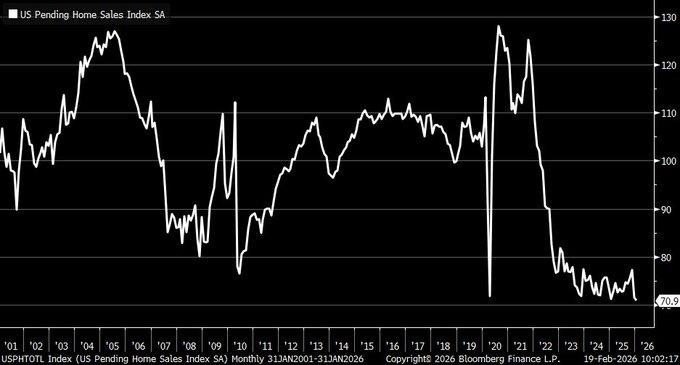
The 2025 trade deficit was slightly lower at $901.5 billion compared to 2024’s $903.5 billion, though it still represents one of the larger deficits in decades. ZCM’s assessment of the 2024 and 2025 numbers indicates that the trade deficit has not made the substantial adjustments that the media and other commentaries have suggested in recent weeks. Goods imports remain well ahead of exports, and the goods deficit has risen to a historic high of $1.24 trillion. Although exports of services have helped to partially offset the imbalance, the numbers have not been sufficient to bring the overall trade deficit into line with past years.
Imports have been rising to meet the demand for goods, and the U.S. dollar’s strength continues to support the demand for imported goods and services, though the adjustments in the U.S.-Mexico and U.S.-Vietnam trade balances suggest that the U.S. has been diversifying its imports, not reducing its demand for imported goods and services. Commentaries on the large reductions in the U.S. trade deficits are not consistent with the actual numbers, and the factors that have driven the deficits to their historic highs remain in place, including the U.S. consumer’s demand for goods and the U.S. dollar’s relative strength, which continues to support the demand for imported goods and services.
From our perspective, the U.S. trade deficits are more closely correlated to the U.S. internal demand momentum than to the U.S. competitiveness in the global market, and based on that, we have identified Caterpillar Inc. (CAT) as undervalued compared to its global peers, and the U.S. internal demand momentum will likely support CAT’s stock price in the coming year, despite the challenges in the global market, including the U.S. trade deficits. Analysts should monitor the export order trends, the U.S. dollar’s movement, core capital goods shipments, and industrial production to determine whether the U.S. investment in infrastructure continues to support the stability of CAT’s earnings, despite the global market conditions that are likely to lead to a gradual adjustment in the U.S. trade deficits.
Philly Fed Signals Output Strength
The February 2026 Philadelphia Manufacturing Index increased considerably, reaching a high of +16.3, surpassing analysts’ forecasts of +7.5 and earlier levels of +12.6. At Zaye Capital Markets, we believe this is a strong indicator of regional factory strength, regardless of the overall volatility in the macro environment. As a matter of fact, the general activity index has been trending upwards since late 2025, which indicates that overall demand in the industrial sector has remained intact. This, in turn, reflects the consistent production and business confidence. Although the overall index has shown strong growth, the underlying components show a moderation in the overall industrial activity, which is of critical importance to market participants seeking to gauge the overall strength.
New orders have eased to +11.7, compared to the earlier levels of +14.4, while shipments have fallen sharply to +0.3, compared to the earlier levels of +9.5. In addition, the average workweek has fallen to -11.6, compared to the earlier levels of +9.1. These are strong indicators of a cooling in the overall industrial activity. Employment has also eased to -1.3, compared to the earlier levels of +9.7, which indicates a cautious hiring trend. At Zaye Capital Markets, we believe that the overall industrial activity has shown strong growth, which is a function of the overall production activity.
We have identified Emerson Electric Co. (EMR) as a strong investment opportunity, given its exposure to the overall automation and industrial software segment. We believe that as the overall industrial activity adjusts, investment in smart factory infrastructure will be strategically important. Analysts are encouraged to monitor forward new orders, capital expenditure, and overall industrial activity to gauge the overall earnings strength in the industrial sector.
Trade Gap Expands as Imports Soar
The trade deficit in December 2025 increased by a substantial margin to reach 70.3 billion dollars, well above the expected 55.5 billion dollars and the 53.0 billion dollars in the previous month. The increase in the deficit is due to a 3.6% increase in imports as consumers’ demand for goods remains high. Simultaneously, exports have reduced by 1.7% as the demand in the international market is decreasing. According to Zaye Capital Markets, the increase in the deficit is demand-driven and does not indicate a loss in competitiveness in the international market. The increase in the deficit is substantial as it is now approaching historical peaks in the deficit.
As a result of the increase in the deficit, we believe that consumers are using their purchasing power to meet their demands despite the high-interest rates that have been implemented in the economy. The decrease in exports is a result of a decrease in demand in the international market and does not indicate any weaknesses in the domestic economy. The total deficit in the economy has reduced slightly to 901.5 billion dollars as the increase in the deficit is not having a substantial impact on the annual deficit.
As a result of the above scenario in the economy, we believe that Caterpillar Inc., or CAT, is an undervalued company as it is related to the industrial sector and is affected by infrastructure projects in the country. Analysts need to be aware of the trends in the dollar, exports, industrial production, and consumer spending to understand whether the weakening in exports will affect the domestic capital investment in the coming years.
Building Permits Show Fragile Housing Base
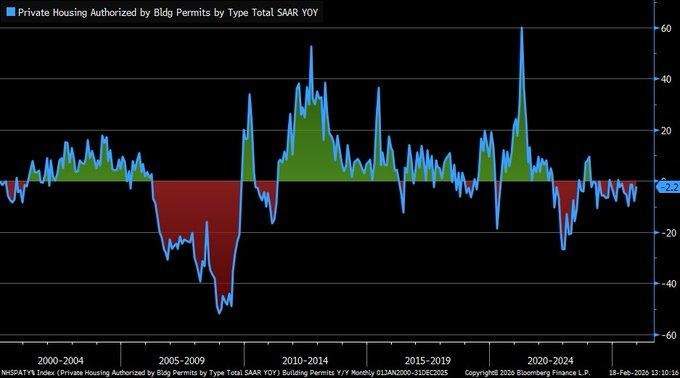
December 2025 building permits increased 4.3% month-over-month to 1.448 million seasonally adjusted annualized units, indicating short-term stabilization in residential planning activity. However, permits remain down 2.2% year-over-year, reflecting ongoing structural softness in housing development. At Zaye Capital Markets, we interpret this divergence as a fragile recovery phase rather than a definitive turnaround. While the monthly rise signals builders are cautiously re-entering the pipeline, elevated mortgage rates and affordability constraints continue to limit broader expansion. The forward-looking nature of permits makes this data particularly important for assessing construction momentum heading into 2026.
The longer-term chart trend shows year-over-year declines persisting at levels consistent with subdued housing cycles. Current readings remain among the weakest in several years, underscoring that residential investment has not fully regained sustained traction. Elevated borrowing costs and slower transaction turnover are likely restraining new project commitments despite incremental month-to-month improvement. We view the recent monthly gain as early stabilization rather than acceleration, with developers carefully managing inventory exposure and capital discipline amid rate uncertainty.
Within this environment, we identify D.R. Horton, Inc. (DHI) as undervalued relative to broader housing pessimism. As one of the largest homebuilders with diversified geographic exposure and scalable operations, it stands to benefit disproportionately if permit activity stabilizes further. Analysts should monitor mortgage rate direction, housing starts, new home sales, and construction employment trends to determine whether permit stabilization translates into sustained residential investment growth through 2026.
NY Services Index Signals Deep Contraction
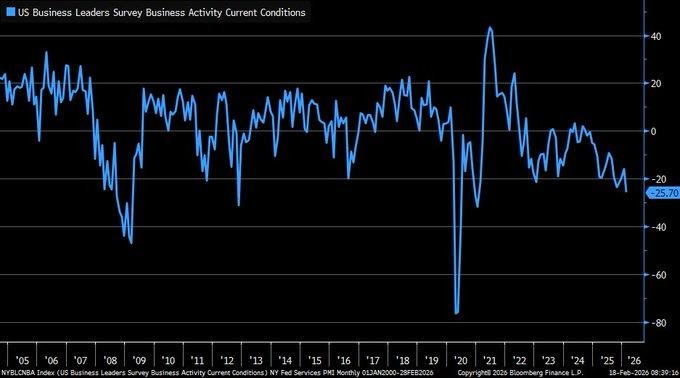
The New York regional Services Activity Index plummeted to -25.7 in February 2026 from -16.1 in January. This is the weakest reading in at least two decades. Based on the assessment by the team at Zaye Capital Markets, the significant decline in the Services Activity Index signals a deep contraction in the regional service sector. The Services Activity Index is a monthly survey conducted in the New York area, northern New Jersey, and southwestern Connecticut. It is a key indicator of the current service sector activity, which is a significant contributor to the overall regional output. A reading below zero indicates net deterioration in the service sector. The Services Activity Index reading at -25.7 indicates weakening demand, weakening client activity, and a rising sense of caution among service-oriented firms. This may be a harbinger of a headwind facing the overall economic growth.
The Services Activity Index reading at -25.7 is a cause for concern since the service sector is a significant contributor to the overall regional output. Although the Services Activity Index is a regional survey, it acts as a precursor to the national-level surveys. Based on the Services Activity Index reading, the service sector activity has declined sharply. In the current scenario, Accenture plc (ACN) appears to be undervalued compared to the overall service sector pessimism.
In a scenario where corporations are facing headwinds in demand, consulting, digital transformation, and cost optimization are strategic priorities. Analysts should look at the national-level service sector surveys, corporate spending plans, and employment trends to gauge whether the regional service sector contraction has stabilized or whether it is a harbinger of a service sector adjustment phase.
Upcoming Economic Events
GBP Retail Sales m/m, French Flash Manufacturing & Services PMI, German Flash Manufacturing & Services PMI, GBP Flash Manufacturing & Services PMI, USA Flash Manufacturing & Services PMI, USA Advance GDP q/q, Core PCE Price Index m/m, Advance GDP Price Index q/q, New Home Sales
As we head into one of the most concentrated macro events of the month, the market is preparing for a string of economic releases that will shape the overall global growth and inflation theme. At Zaye Capital Markets, we do not view these releases as individual events but rather a web of macro releases that will shape the overall market direction simultaneously. Business activity releases will offer a forward-looking view into the overall health of the corporate sector, while hard economic releases from the USA will shape the overall macro theme in the market. Markets tend to trend decisively when survey releases confirm hard data strength.
GBP Retail Sales m/m
As we look at the retail sales release from the UK, we view this release as one of the best macro releases to gauge the overall health of the consumer.
- If the actual number prints significantly higher than the forecast, we will take it as a sign that the consumer is still quite strong and able to digest higher interest rates. This should be a positive for the pound, retail stocks, and overall market sentiment. In addition, a strong retail sales number should be viewed positively by the market as it should bode well for wages and the overall consumer balance sheet.
- However, a retail sales number that prints lower than the forecast will only add to the overall macro theme of a weakening consumer.
French & German Flash Manufacturing and Services PMIs
These preliminary measures of business activity represent a ‘pulse check’ of the health of the Eurozone.
- A better-than-forecast reading for both the manufacturing and services sectors will indicate an improvement in order books and business sentiment. This is likely to benefit European stock markets, particularly industrial sectors. It will also strengthen the Euro.
- On the other hand, disappointing readings for the PMIs will reinforce recession risks and highlight the persistence of weakness in production and service sector activity. Underperforming manufacturing data will have implications for export-oriented sectors. On the other hand, disappointing services data will likely reflect domestic demand issues for the Eurozone.
GBP & USA Flash Manufacturing and Services PMIs
For the United Kingdom and the USA, flash PMIs are extremely important because they represent the ‘pulse check’ of the private sector.
- Better-than-forecast readings for both the manufacturing and services PMIs will likely reinforce the growth narrative. This is likely to benefit cyclical stock markets. It will also boost bond yields.
- On the other hand, disappointing readings for the PMIs will likely reinforce growth worries. This is likely to benefit defensive sectors and bonds. The services component is particularly important because it accounts for the majority of economic output.
USA Advance GDP q/q, Core PCE m/m, Advance GDP Price Index q/q
The above series form a core backdrop to growth and inflation trends.
- If Advance GDP surprises to the upside, but inflation remains robust, this could reinforce a higher-for-longer rate market view, supporting a stronger dollar and rate-sensitive sectors such as housing and technology. On the other hand, a solid GDP growth rate but softer inflation could lead to a broadening in market risk appetite, as growth appears to be sustaining without inflation pressures.
- However, a soft GDP growth rate but still high inflation could create a complex market environment, resulting in volatility as a result of rate uncertainty. On the other hand, a weak growth rate coupled with a weak inflation rate could lead to a resumption in easing bets, favoring growth-oriented asset classes.
New Home Sales
The housing market is a very sensitive sector, particularly in relation to rate decisions and consumer confidence.
- If this data comes in higher than expected, this could suggest to investors that consumers are adapting to current rate levels. This could be a positive indicator for homebuilders and consumer-related sectors. This could also reinforce the view that household income remains a core driver in the US economy.
- However, if this data comes in below expectation, this could reinforce a view that affordability remains a key issue in the US housing market. Analysts should be looking at trends in mortgage rates, housing inventory, and homebuilder sentiment to determine whether housing is turning around or whether it is entering a further phase of contraction.
Stock Market Performance
Indexes Rebound from April Lows, But Breadth Divergence Persists
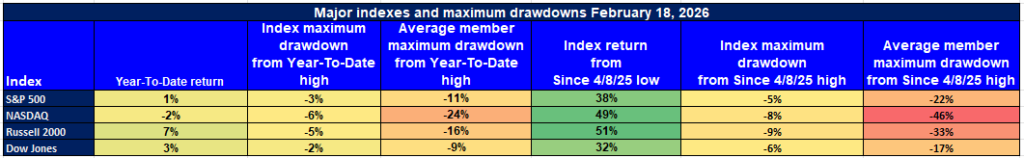
The U.S. stock markets have experienced a robust rebound from their year-to-date lows recorded on April 8, 2025. Despite this rebound, year-to-date performance and drawdown statistics point to a less-than-synchronized performance by the markets. As a firm at Zaye Capital Markets, we have seen that although the markets have performed well in recent times, the performance of the average constituent stock does not paint the same picture. This divergence in performance between the index and the average constituent stock indicates that leadership in the markets remains concentrated.
The following is a structured analysis based on the exact figures provided:
S&P 500: Stable Index, Moderate Internal Stress
YTD: +1% | +38% since 4/8/25 low | -3% from YTD high | Avg. member max DD (YTD): -11%
The S&P 500 index has risen by 1% year to date and by 38% since the year-to-date low recorded on April 8, 2025. This indicates robust performance by the large-cap stocks that form the index. Although the index recorded a 3% maximum drawdown from its year-to-date high, the average member recorded a maximum drawdown from its year-to-date high of 11%. This indicates significant stress for the average constituent stock. Since the year-to-date low recorded on April 8, 2025, the S&P 500 index recorded a maximum drawdown of 5%. This is significantly less than the 22% maximum drawdown recorded by the average constituent stock.
NASDAQ: Strong Rebound, Elevated Member Volatility
YTD: -2% | +49% since 4/8/25 low | -6% from YTD high | Avg. member max DD (YTD): -24%
The NASDAQ has declined 2% YTD, yet has rallied 49% since its low in April. It has declined 6% from its YTD high, which indicates the major growth stocks are holding up. However, the average member has declined 24% from its YTD high, which indicates the stocks in the NASDAQ are experiencing a great deal of volatility. Since the low in the NASDAQ on April 8, the NASDAQ has declined 8%, while the average member has declined 46%.
Russell 2000: YTD Leader with Continued Stock Dispersion
YTD: +7% | +51% since 4/8/25 low | -5% from YTD high | Avg. member max DD (YTD): -16%
The Russell 2000 has been the YTD leader, increasing 7%. It has rallied 51% since its low in April. It has declined 5% from its YTD high, which indicates small-cap stocks are holding up. However, the average member has declined 16% from its YTD high, which indicates the stocks in the Russell 2000 are volatile. Since the low in the Russell 2000 in April, it has declined 9%, while the average member has declined 33%.
Dow Jones: Defensive Structure, Narrower Drawdowns
YTD: +3% | +32% since 4/8/25 low | -2% from YTD high | Avg. member max DD (YTD): -9%
The Dow Jones has appreciated by 3% YTD and has risen by 32% from its low in April, which shows the steady performance of the index due to its defensive composition. The maximum drawdown from the YTD high is only 2%, which shows the stability of the index. On the other hand, the maximum drawdown from the YTD high for the average member is at 9%, which shows the presence of volatility. Since the 8th of April, the maximum drawdown for the Dow Jones is at 6%, whereas the maximum drawdown from the YTD high for the average member is at 17%.
At Zaye Capital Markets, we remain focused on monitoring the breadth indicators, and though the rebound momentum can be seen in the major indices, confirmation will be required in terms of sustained improvement in the average performance of the constituents to validate the structurally durable rally phase.
The Strongest Sector In All These Indices
Energy Leads Year-to-Date and Month-to-Date Performance
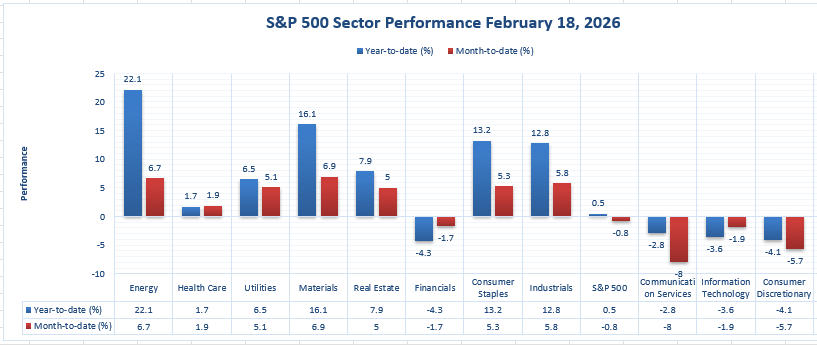
As we review the latest available sector performance figures at Zaye Capital Markets, it is quite clear to us that the sector which is faring the best is the Energy sector. In fact, the Energy sector is up +22.1% year to date and +6.7% month to date, making it the clear leader compared to the other sectors in the S&P universe. Not only is the Energy sector faring the best year to date, but it is also the best performer month to date. This shows us a clear indication of a sustained trend into the sector rather than a one-time blip.
If we compare the other sectors to the Energy sector, we see the Materials sector at +16.1% year to date and +6.9% month to date. Next is the Consumer Staples sector at +13.2% year to date and +5.3% month to date. Then we have the Industrials sector at +12.8% year to date and +5.8% month to date. Although these sectors are faring quite well, none are able to keep up with the +22.1% year to date performance of the Energy sector.
Even the defensive sectors like the Utilities sector at +6.5% year to date and +5.1% month to date, and the Real Estate sector at +7.9% year to date and +5.0% month to date, are unable to keep up with the performance of the Energy sector. In fact, there are several sectors which are still in the red year to date, like the Financials sector at -4.3%, the Communication Services sector at -2.8%, the Information Technology sector at -3.6%, and the Consumer Discretionary sector at -4.1%.
On a month to date basis, the Communication Services sector at -8.0%, the Consumer Discretionary sector at -5.7%, and the Financials sector at -1.7%, are all still struggling. Even the S&P 500 index itself is only up +0.5% year to date but down -0.8% month to date. From our perspective at Zaye Capital Markets, it is quite clear to us that the strongest sector in the market today is the Energy sector.
Earnings
Yesterday’s Earnings – 19-Feb-2026
- Airbus SE: Revenues stood at €73.4 billion, up 6% from last year’s figure of €69.2 billion, while Adjusted EBIT came in at €7.1 billion, up 33% from last year’s figure of €5.4 billion, and Reported EBIT at €6.1 billion. Net Income came in at €5,221 million, up 23% from last year’s figure of €4,232 million, while reported EPS came in at €6.61, up 23% from last year’s figure of €5.36. Free Cash Flow before customer financing came in at €4.6 billion, supported by 793 commercial aircraft deliveries. A dividend of €3.20 per share was proposed, while 870 commercial aircraft deliveries, around €7.5 billion of Adjusted EBIT, and free cash flow before customer financing of around €4.5 billion are guided for 2026.
- Newmont Corporation: Newmont Corporation reported that its full-year 2025 attributable gold production came in at approximately 5.9 million ounces, while Reported Net Income came in at $7.2 billion, while Adjusted Net Income came in at $7.6 billion or $6.89 per diluted share, while Adjusted EBITDA came in at $13.5 billion, Operating Cash Flow came in at $10.3 billion, while a new record of free cash flow of $7.3 billion came in during the year, while in Q4, Adjusted Net Income came in at $2.753 billion or $2.52 per diluted share, while Revenue came in at $6.818 billion, while a dividend of $0.26 per share was declared, while 5.3 million gold ounces are guided in 2026.
- Southern Company: Reported full-year earnings came in at $4.3 billion or $3.94 per share, while Adjusted earnings came in at $4.7 billion or $4.30 per share, while Operating Revenues came in at $29.55 billion, up 10.6% from last year, while in Q4, Reported earnings came in at $416 million or $0.38 per share, while Adjusted earnings came in at $612 million or $0.55 per
- Nestle S.A.: Sales stood at CHF 89,490 million, down 2.0% reported, while organic growth came in at 3.5%. Underlying Trading Operating Profit came in at CHF 14,389 million, with a margin of 16.1%. Net Profit attributable to shareholders came in at CHF 9,033 million. Basic EPS came in at CHF 3.51, while Underlying EPS came in at CHF 4.42. Free Cash Flow came in at CHF 9,154 million. A dividend of CHF 3.10 per share is proposed, along with organic growth of 3% to 4%.
- Zurich Insurance Group Ltd: Business Operating Profit came in at USD 8.9 billion, up 14%. Net Income attributable to shareholders came in at USD 6.8 billion, up 17%. Core Return on Equity came in at 26.9%. Property & Casualty BOP came in at USD 5.1 billion, while the Combined Ratio came in at 92.6%. Proposed dividend increased to CHF 30 per share. SST Ratio came in at 259%, a strong indicator of stable capital.
- Rio Tinto plc: Underlying EBITDA came in at $25.363 billion, up 9%. Underlying Earnings came in at $10.868 billion. Net Earnings came in at $9.966 billion, while Sales Revenue came in at $57.6 billion. Net cash generated from operating activities came in at $16.832 billion, while copper equivalent production increased by 8%. An Ordinary Dividend of $6.5 billion is declared, representing 60% payout.
Today’s Earnings Preview — 20-Feb-2026
- PPL Corporation: Investors need to keep an eye on reported earnings per share, regulated revenue performance, capital expenditure, and dividend sustainability in the coming quarters. Investors will also need to keep an eye on grid modernization investments, rate base expansion, and regulatory outcomes to invest in defensive utilities.
- Lamar Advertising Company Class A: The focus would be on revenue growth for traditional billboards and digital ads, occupancy rates, pricing trends, operating margins, and free cash flow. The strength of the overall advertising demand would be crucial for the overall sector.
- Anglogold Ashanti PLC: Key indicators to track include gold volume, all-in sustaining costs, operating cash flow generation, and the company’s 2026 production forecast. Margin movements relative to gold price movements and capital discipline continue to be key drivers of the company’s valuation.
- Danone SA: Revenue growth by region, pricing versus volume contributions to revenue growth, operating margin trends, and free cash flow generation need to be tracked by investors. Resilience of demand in key categories and the execution of cost management initiatives will be key to earnings sustainability.
Stock Market Overview – Friday, 20 Feb 2026
US stock markets are opening with a sense of measured caution as investors continue to digest a mix of robust economic data, mega-cap stock weakness, and a revived geopolitical risk factor in the oil patch. While the overall markets are not in a free-fall, the underlying strength of the markets continues to be a concern. The Dow Jones and the Russell 2000 continue to show relative strength, while the Nasdaq and the S&P 500 are struggling as technology continues to be a concern. As a capital markets company, Zaye Capital Markets continues to focus on the underlying strength of the markets before calling a continuation of the uptrend.
Stock Prices
Economic Indicators and Geopolitical Developments
The markets today are a tug of war between the strength of the economy and the sensitivity of the markets. Earlier in the week, the labor data released continued to affirm the rate hike narrative, keeping bond rates high. The inflation rate continues to be sensitive to the price of oil, especially as the geopolitical situation in the Middle East continues to push oil prices to historic highs. The macroeconomic environment continues to be favorable, but it’s no longer accelerating, and that’s what’s driving the markets today.
Latest Stock News
- $ASTS | BlueBird 7 has been encapsulated inside Blue Origin’s New Glenn rocket and is moving toward low Earth orbit deployment. This is yet another milestone in the scaling of the first space-based cellular broadband network directly connecting to standard smartphones, further emphasizing long-term infrastructure optionality within satellite communication.
- $APP | AppLovin is planning to launch its own next-generation social media platform after its bid to acquire TikTok failed. The company is planning to create its own organic traffic using its ad-tech engine. This is the reverse of the conventional approach of building an audience first and then focusing on monetization.
- $AMZN | Amazon ($717B) is now the largest company in the world by revenues, surpassing Walmart ($713B). This is a result of the success of the AWS cloud infrastructure, AI platforms like Trainium and Bedrock, the $56B advertising segment, and vertically integrated enterprise AI and cloud infrastructure.
- $HIMS | Hims is acquiring Eucalyptus for $1.2B, which adds $450M in run-rate revenues and 775K customers from Australia, Japan, the UK, Germany, and Canada. This is a major boost to Hims’ international scale within the digital health space.
- $GOOGL | Google Cloud achieved 48% growth last quarter with a $240B backlog. Gemini 3.1 Pro is now the #1 agentic AI and coding benchmark across multiple platforms.
The Magnificent Seven and the S&P 500
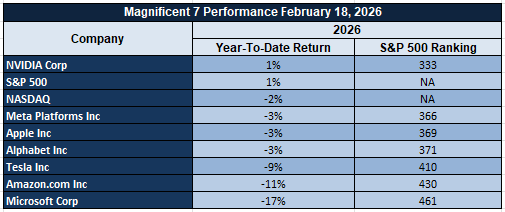
The Magnificent Seven, comprising Apple, Microsoft, Nvidia, Amazon, Meta, Alphabet, and Tesla, continue to dominate index performance. In recent weeks, these groups have faced further pressure as investors review AI monetization, capital expenditure, and earnings sustainability. The structural stories remain positive, but short-term multiple compression and profit-taking have restricted upside movement in the S&P 500 and Nasdaq Composite indices. There has been further evidence of non-mega-cap S&P 500 constituents delivering stronger performance, indicating internal strength rather than weakness. The strength of the market rests on the ability of these groups to break out beyond their exposure to technology.
Major Index Performance as of Friday, 20 Feb 2026
- S&P 500: Currently trading at 6,874.45. This reflects the moderate downward pressure seen in the market as a result of the mega-cap valuation rebalancing.
- Nasdaq Composite: Currently trading at 22,682.73. This reflects the volatility seen in the AI/technology stocks as a result of the rate sensitivity.
- Dow Jones Industrial Average: Currently trading at 49,451.53. This reflects the support seen in the industrial and energy sectors as a result of the overall macro cautions.
- Russell 2000: Currently trading at 2,661.25. This reflects the relative strength seen in the small-cap sectors.
At Zaye Capital Markets, we have a selective risk posture. This is neither capitulation nor an expansion phase. It’s neither an expansion phase nor a capitulation phase.
Gold Price: Gold Price at $4,995 – How Trade Deals, Geopolitics, and Economic Data Are Influencing Safe Haven Assets
Currently, the spot gold price is trading at $4,995 per ounce and is holding below the $5,000 level as the market processes the impact of the recent geopolitical diplomatic efforts, the changing landscape of international trade relations, and the crucial macroeconomic data points being released today. The recent high-level diplomatic efforts and the announcements of the new bilateral trade deals, the changes in the tariff levels, the inclusion of access to critical minerals, and the multi-billion-dollar commercial deals indicate the changing landscape of international trade relations rather than stability in the market. The recent landmark trade cooperation with Indonesia is reducing the tension in the respective sectors of the economies of the two nations, including the energy sector, the aviation sector, the agriculture sector, and the digital sector. At the same time, the decision to maintain the 19 percent rate of reciprocal tariff levels on the imports from each other is an indication of the underlying tension between the two nations. Meanwhile, the recent remarks on the developments in the Iran talks within the next ten days, the extension of the international stabilization forces, and the multi-billion-dollar reconstruction efforts in Gaza indicate the underlying geopolitical risks in the market. Such underlying geopolitical and international trade relations developments historically indicate an increase in the demand for the hard asset gold as a hedge against the underlying risks.
The upcoming economic indicators, such as the Flash Manufacturing and Services PMI for the United States, Advance GDP q/q, Core PCE Price Index m/m, GDP Price Index q/q, and New Home Sales, will be crucial in determining the near-term gold price movements. If the GDP and PMI data disappoint, and the inflation data soften, the real rates will continue to decline, making gold a more attractive investment destination, especially as it does not pay a coupon. However, in the event of a strong GDP and inflation data, the real rates will increase, making gold less attractive as the dollar will appreciate. The recent labor data, which held up well, and the mixed data on regional manufacturing activity have created a balanced but cautious sentiment. The growth rate continues to be stable but not accelerating, inflation risks remain, and the geopolitical risks are still elevated. The combination of stable macro data, unresolved global tensions, and the shift in global trade flows has created a three-pillar support for the gold price at the current record levels. Until the real rates rise significantly or the geopolitical risks abate considerably, the price of gold at the $5,000 level can be viewed as a function of prudent asset allocation and not as a result of a speculative bubble.
Oil Prices: Oil Prices Near $72 – How Geopolitics, OPEC Policy, and US Data Contribute to Crude Oil Price Volatility
Crude oil is currently trading at $71.87 per barrel, with the US West Texas Intermediate (WTI) oil price trading at $66.66 per barrel as of Friday, 20th February 2026. The recent rise in the oil price is due to the layered risk premium built into the market due to the high geopolitical tension and strategic developments in international trade relations. The recent diplomatic efforts and talks of an increased stabilization force have added risk to the overall crude oil price, especially with the strategic location of Middle Eastern shipping routes. Despite the recent landmark announcements of strategic trade relations with Indonesia, including $15 billion in energy purchases, the decision to maintain the 19 percent tariff rate is a reminder of the underlying tension in international relations. The recent rise in the oil price is not only due to the overall demand from the recent strategic developments in international relations; it is also due to the overall risk of a potential supply disruption in the event of an escalation in the tension between the two nations. The overall tightening of the market is supported by the disciplined OPEC+ production management and the overall stable demand growth projections from the International Energy Agency.
With regards to economic data, the recent figures released have been favorable and show that the economy remains steady and not in a state of contraction. This bodes well for the overall energy consumption projections. A strong labor market, for instance, bodes well for transportation and industrial fuel demand. However, the mixed messages from the regional manufacturing data, while encouraging, need not be taken as a reason for undue optimism. Today’s economic data releases, including the U.S. Flash PMI, Advance GDP q/q, Core PCE Price Index m/m, GDP Price Index q/q, and New Home Sales, will have a direct impact on the direction of the price of crude oil. Stronger-than-expected economic releases for the U.S. GDP and/or the U.S. Flash PMI could reinforce the bullish sentiment for the price of oil. However, a stronger-than-expected release for the Core PCE and/or the U.S. GDP could lead to a stronger dollar, and the price of oil could fall. At the moment, the price of oil is not being influenced as much by the oversupply situation as much as the overall risk management strategies being employed.
BITCOIN PRICES: Bitcoin Price at $67,201: How Trade Diplomacy, Geopolitics, and US Economic Data Are Influencing the Cryptocurrency Price Trends
Bitcoin is currently at $67,201, with a high and low of $67,289 and $67,146, respectively. This shows the price consolidation between the $65,000 and $68,000 price points. The price structure shows a lack of directional momentum as the volumes are below the average and the derivatives are at a neutral level. The ETF flows are stable as the outflows are decreasing. The on-chain data shows mixed signals as there are neither buying nor selling pressures. The price is expected to consolidate around the $68,000 mark as it is considered a resistance level. The $65,000 price level is considered a structural support level. The price is consistent in the European region, as the price is around €78,000. This shows that the price consolidation is a global phenomenon. The technical indicators are below the recent highs but are still maintaining the higher lows compared to the recent correction. This shows that the price is in a consolidation phase rather than a downtrend. The price is not correlated with the stock markets. This shows that the price is determined by the crypto markets.
The recent trade and geopolitical events spearheaded by President Trump are affecting Bitcoin through indirect macroeconomic transmission mechanisms rather than direct regulation. The Indonesia trade deal, which eliminates tariffs on more than 99 percent of products, increases digital trade access, removes licensing requirements, and locks in $33 billion in business deals, indicates improved trade relations that can positively affect global economic stability. However, the maintenance of a 19 percent reciprocal tariff rate, threats of possible implications on Iran in ten days, expansion of stabilization forces that may reach 20,000 troops, and multi-billion-dollar reconstruction deals in Gaza, all add to the geopolitical tensions that can affect global economic stability. The two factors that are affecting global economic stability are trade cooperation and rising geopolitical tensions. The economic indicators released yesterday on labor conditions and regional manufacturing results provided stability to the global economic ecosystem, which has helped maintain Bitcoin prices near crucial support levels. The economic indicators to be released today on Flash PMI, Advance GDP, Core PCE Price Index, and New Home Sales may have significant implications on Bitcoin prices. A lower growth rate and lower inflation may result in lower prices, pushing it to resistance, whereas higher growth rates and higher inflation may result in higher values of the US dollar, which may prevent it from moving higher. The price of $67,000 reflects balance rather than speculation in the current ecosystem.
ETH PRICES: Why Is Ethereum Trading Near $1,950 as Institutional Flows and Whale Activity Influence Crypto Markets?
At the moment, the price of Ethereum is trading around the $1,950 mark per ETH. This indicates that the cryptocurrency has been trading around the psychological mark of $2,000 while struggling to go past it. However, the price has been rising while maintaining support around the lows. In the past week, the cryptocurrency has been consolidating its price action within a set range. This indicates that the market has been indecisive about the direction of the price. However, technical indicators have been showing a decrease in the overall volatility of the cryptocurrency. In the past few weeks, there has been a decline in the overall institutional interest in the cryptocurrency. However, the latest data indicates that the week ending 18 February has seen a small inflow of around $6.8 million in the spot Ethereum ETFs. This indicates that the interest of the institutional investors has started to pick up. In the past few days, the whale wallets have increased their overall ETH holdings by around 130,000 ETH (~$253 million). This indicates that the overall market has started to gain confidence. However, the overall trading volume has been low in the past few days. This indicates that the overall market has been indecisive about the direction of the cryptocurrency. However, the overall data indicates that the cryptocurrency has been trading around the equilibrium mark. This has been reflected by the overall data coming out of the Asian and European exchanges.
In addition, macro-economic and geopolitical factors are also impacting the overall sentiment on the price dynamics of Ethereum. The mixed macro-economic releases from the United States, with employment numbers remaining resilient but mixed signals from the U.S. manufacturing sector, are leading to a macro-economic scenario in which growth is steady but not accelerating. This scenario is likely to keep the markets on the back foot and encourage diversification. The recent slew of announcements by President Trump on trade and macro-economic issues, covering landmark deals with Indonesia, digital trade access, changes in tariffs, and the possibility of developments in Iran in the next ten days, are likely to keep the macro-economic scenario volatile. Very high geopolitical risk premia are likely to support decentralized assets like Ethereum, especially in a scenario in which traditional markets are characterized by structural ambiguity. The interplay between trade optimism and high geopolitical risks only serves to reinforce the view that ETH is a growth asset as well as a safe haven asset, depending on the overall macro-economic scenario. Going forward, macro-economic releases from the United States, covering Flash PMI, Advance GDP, and Core PCE inflation, are likely to drive the momentum in the price dynamics of Ethereum. If the macro-economic releases are softer and growth and inflation are moderating, it may re-energize flows into ETH. Conversely, stronger macro-economic releases are likely to drive the U.S. Dollar and keep the price dynamics in a state of consolidation below resistance. From the perspective of Zaye Capital Markets, the current phase in the price dynamics of Ethereum is structural consolidation aided by nuanced flows.
