Where Are Markets Today?
European and U.S. equity futures are positioned to open lower as global markets enter a new trading month under clear risk-off conditions. U.S. futures are leading the downside, with pressure concentrated in growth-heavy benchmarks as Nasdaq-linked contracts underperform broader indices. European futures are also trading softer, reflecting spillover from U.S. markets rather than region-specific weakness. The dominant theme is a broad reassessment of risk following sharp late-week moves across crypto and precious metals, which has unsettled investor confidence and tightened financial conditions heading into a data- and earnings-heavy week.
The first major driver behind the weaker positioning is cross-asset deleveraging. Bitcoin’s drop below $80,000 and its slide toward the mid-$70,000s has acted as a warning signal that speculative risk is being actively reduced rather than rotated. This move followed an extreme liquidation event in precious metals, where silver suffered its worst single-day decline in decades and gold experienced a sharp drawdown after an extended rally. These violent adjustments in traditionally uncorrelated assets have forced global portfolios to reduce exposure, pressuring equity futures in both Europe and the U.S. as volatility expectations rise and liquidity becomes more selective.
A second source of pressure is uncertainty around the artificial intelligence trade and earnings durability, particularly in the U.S. market. Reports that a major planned capital deployment into the AI ecosystem has stalled have raised broader questions about execution risk, capital discipline, and return visibility across the technology complex. With more than 100 large-cap companies reporting earnings this week, futures are pricing in the risk of post-earnings volatility rather than focusing on aggregate earnings strength. Recent examples of strong results followed by sharp sell-offs have made investors more cautious, especially toward stocks that have carried heavy positioning and premium valuations.
Finally, macro and policy ambiguity continues to weigh on sentiment. The nomination of a new Federal Reserve chair has reintroduced uncertainty around the timing and communication of future rate cuts, while upcoming labor market data adds another layer of risk. For European markets, the combination of U.S. policy uncertainty, global growth sensitivity, and tighter financial conditions is enough to suppress risk appetite despite relatively stable regional fundamentals. Until volatility in crypto and commodities stabilizes and earnings outcomes reduce uncertainty, futures on both sides of the Atlantic are likely to remain defensive rather than rebound decisively.
Major Index Levels as of Monday, 2 Feb 2026
- Nasdaq Composite: Trading at 23,501.24, supported by selective large-cap technology strength amid elevated volatility.
- S&P 500: Trading at 6,915.61, holding near recent highs but struggling to extend gains due to narrow leadership.
- Dow Jones Industrial Average: Trading at 49,098.71, facing modest pressure as industrial and value components react to tighter conditions.
- Russell 2000: Trading at 2,669.16, underperforming as small-cap and economically sensitive stocks remain constrained.
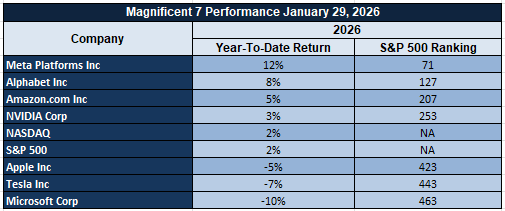
The Magnificent Seven and the S&P 500

The S&P 500 remains heavily influenced by the “Magnificent Seven,” but that concentration has become a source of vulnerability. These stocks are being punished as valuation compression, earnings normalization, and elevated discount rates intersect. With leadership increasingly narrow, weakness in a handful of names is exerting disproportionate pressure on index performance. The lack of broad participation continues to mask deeper structural fragility beneath headline resilience.
Drivers Behind the Market Move – Monday, 2 February 2026
As U.S. and European markets open the new trading week, investor sentiment is shaped by a combination of policy uncertainty, incoming economic data, and elevated cross-asset volatility. Recent political commentary, coupled with key manufacturing indicators due today, has reinforced a cautious, risk-aware stance across global markets.
1. Monetary Policy Uncertainty Following Fed Leadership Signals
Markets continue to digest recent comments from Donald Trump regarding the nomination of Kevin Warsh as the next Federal Reserve Chair. While the messaging has emphasized confidence that the nominee supports lower interest rates over time, the parallel insistence that rate policy should not be publicly scrutinized has reduced near-term clarity. Investors have interpreted this as increasing the risk of delayed or uneven policy easing rather than an immediate pivot. As a result, real yields remain elevated, the dollar has stabilized, and rate-sensitive assets — particularly growth stocks — are under pressure in both U.S. and European markets.
2. Focus on Manufacturing Data and Growth Momentum
Attention is firmly on today’s ISM Manufacturing PMI and ISM Manufacturing Prices data, following yesterday’s releases that showed persistent cost pressures alongside signs of slowing momentum. This data mix has raised concerns that growth may cool without inflation easing meaningfully, complicating the policy outlook. A weaker PMI reading would likely reinforce slowdown fears and weigh further on equities, while stronger pricing data could tighten financial conditions by pushing rate-cut expectations further out. This binary setup has encouraged a wait-and-see approach, contributing to subdued risk appetite across regions.
3. Risk-Off Spillover From Cross-Asset Volatility
Sharp late-week moves in Bitcoin and precious metals have tightened global risk conditions, prompting portfolio de-risking that has spilled into equities. This cross-asset volatility has been particularly influential for European markets, which remain sensitive to global liquidity shifts rather than purely domestic fundamentals. Combined with ongoing fiscal uncertainty and geopolitical commentary, these dynamics are driving investors toward capital preservation and defensive positioning, keeping volatility elevated and market participation selective as the week begins.
Digesting Economic Data
The Trump Tweets and Its Implications
The most market-sensitive development across the recent sequence of statements is the nomination of Kevin Warsh as the next Federal Reserve Chair and the repeated emphasis that the nominee favors lower interest rates. While the messaging has been framed as supportive of future rate cuts, markets have interpreted the signal more cautiously. The insistence that it is inappropriate to question the nominee on rate policy introduces uncertainty rather than clarity, reinforcing the perception that monetary policy direction may be influenced indirectly rather than guided transparently. This ambiguity has immediate implications for financial conditions: it has contributed to volatility in yields, pressured rate-sensitive assets, and complicated expectations around the timing and pace of policy easing. The added backdrop of stalled funding talks and the rising risk of a government shutdown has further elevated uncertainty premiums across markets, tightening financial conditions even as the rhetoric points toward easier policy over time.
On the geopolitical front, comments surrounding Iran and Cuba have introduced a shifting risk narrative rather than a clear de-escalation. While diplomacy has been highlighted as the preferred route, the repeated caveat that force remains an option has kept geopolitical risk priced into energy, currency, and defensive assets. Statements indicating that Iran is negotiating seriously, alongside claims that talks with Cuba could trigger political instability, have generated mixed reactions globally. Markets have treated these developments as headline-driven risk rather than structural resolution, resulting in short-term swings in oil prices and defensive positioning rather than sustained trend changes. The announcement that India will purchase Venezuelan oil under a new supply arrangement has also added complexity to the energy outlook, reinforcing uncertainty around supply flows, sanctions enforcement, and global energy alignment.
Domestically, the executive actions and cultural initiatives — including the Freedom 250 Grand Prix and the reshaping of federal cultural institutions — have had limited direct market impact but contribute to a broader perception of an administration willing to use executive authority assertively. More consequential for markets are the comments around federal response to protests and immigration-related unrest, which intersect with the ongoing funding deadlock. The acknowledgment of a House-Senate impasse, despite passage of a funding measure in the Senate, keeps fiscal risk elevated. Historically, prolonged shutdown risk weighs on confidence, dampens risk appetite, and strengthens demand for liquidity and defensive positioning, particularly when combined with monetary uncertainty.
Taken together, these statements reinforce a macro environment defined by policy ambiguity rather than directional clarity. Markets are being asked to balance future-leaning rhetoric about lower rates and diplomatic progress against near-term uncertainty driven by funding risk, geopolitical caveats, and institutional change. The net effect has been increased volatility across rates, commodities, and risk assets, with investors placing greater emphasis on incoming economic data for confirmation rather than relying on political signaling alone. In this context, sentiment remains reactive, and asset pricing continues to reflect caution rather than conviction.
Producer Inflation Rebuilds Policy Friction
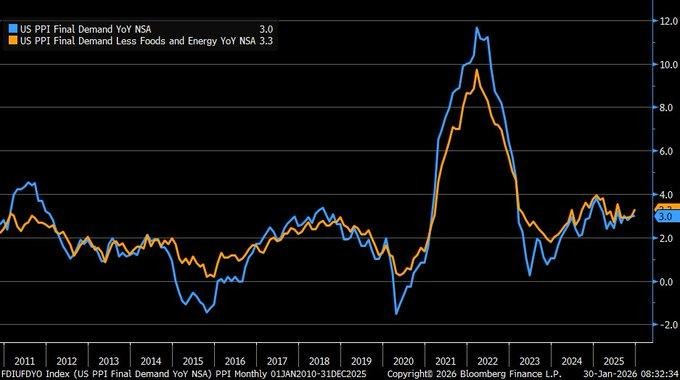
Producer price inflation firmed again at the end of the year, with headline prices holding at 3% year-over-year and core producer inflation accelerating further. We interpret this as a clear signal that the earlier cooling trend in upstream prices has paused rather than resolved. The composition of the increase is particularly important: service-related input costs rose sharply on a monthly basis, reinforcing the idea that inflation pressure is shifting away from volatile goods and toward structurally sticky service components. This type of inflation is historically slower to unwind and tends to feed directly into business cost structures through wages, logistics contracts, and outsourced services.
From a macro perspective, persistent producer inflation complicates the path toward easier financial conditions. When upstream costs stabilize above long-term comfort levels, companies face a choice between absorbing margin pressure or passing costs downstream. This dynamic raises the risk that consumer price disinflation stalls, even if demand growth moderates. We see this data reducing confidence in near-term easing assumptions, especially if services inflation remains elevated in subsequent releases. Analysts should closely track margin commentary, pricing actions, and forward cost guidance from management teams, as these will reveal whether cost pressure is becoming embedded across sectors.
In this environment, we identify industrial automation and efficiency-focused manufacturers as undervalued relative to their earnings durability. When cost pressures persist, businesses tend to prioritize capital spending that improves productivity, reduces labor dependence, and stabilizes margins. Companies supplying automation hardware, control systems, and digital efficiency tools stand to benefit from this shift, yet valuations often lag during inflation-driven uncertainty. Analysts should watch order backlog quality, pricing realization, service revenue growth, and customer capital spending discipline to assess whether efficiency-led investment demand is gaining structural momentum.
Policy Tone Turns Restrictive Again
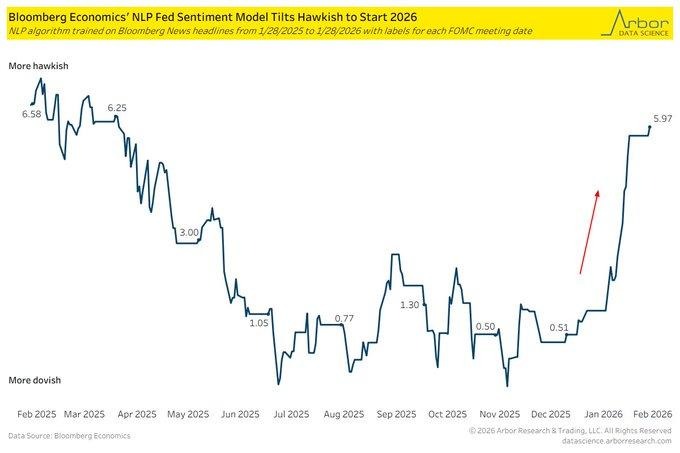
We observe a sharp shift in policy communication tone at the start of the year, with language analysis of central bank commentary signaling a return to a more restrictive stance after a notably accommodative period mid-year. The change reflects a broader recalibration in how inflation risks are being framed, moving away from confidence in sustained cooling toward caution about renewed persistence. This rhetorical adjustment matters because communication often precedes action, shaping financial conditions well before policy settings change. Markets indicate that this tonal reset has reset expectations around the speed and certainty of future easing.
The disconnect between market pricing and policy language is now widening. While investors continue to anticipate lower rates later in the cycle, firmer messaging suggests that policymakers remain uncomfortable declaring victory over inflation. This increases the risk of higher bond yields and tighter financial conditions if incoming data supports inflation resilience. For risk assets, the implication is asymmetric: upside becomes more limited while downside sensitivity to data surprises increases. Analysts should closely monitor inflation-linked releases, labor cost indicators, and shifts in forward guidance language for confirmation that restrictive intent is translating into policy durability.
Within this backdrop, we see value emerging in large-cap defensive growth companies with strong balance sheets and stable cash generation that can withstand higher discount rates. Businesses with recurring revenues, pricing flexibility, and limited refinancing needs appear undervalued relative to their long-term earnings visibility. These firms often underperform during periods of rate uncertainty despite improving fundamentals. Analysts should focus on interest coverage ratios, maturity profiles of debt, free cash flow stability, and guidance around capital allocation discipline to identify which names are best positioned as policy patience is tested.
Inventory Discipline Signals Demand Stability
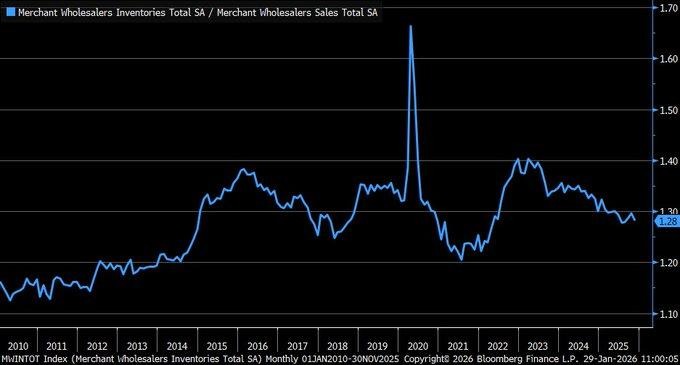
We are seeing a continued decline in the merchant wholesale inventory-to-sales ratio, falling to 1.28 late in the year and extending a steady downtrend from the post-cycle highs reached earlier in the decade. This ratio matters because it captures the balance between real demand and stock accumulation across distribution channels. A lower reading indicates that sales are absorbing inventory efficiently, reducing the risk of forced discounting or abrupt production cuts. Unlike periods where inventories swell due to demand misreads, the current pattern reflects disciplined inventory control aligned with actual sales momentum rather than speculative stocking.
From a macroeconomic perspective, this dynamic points to underlying economic resilience rather than late-cycle excess. Inventory levels are still rising modestly, but at a pace that remains comfortably below sales growth, suggesting that businesses are managing supply chains with precision. This reduces the probability of deflationary pressure from excess goods while also limiting downside risks to manufacturing output. Analysts should view this as a stabilizing signal for near-term growth, as inventory drawdowns tend to amplify volatility only when sales weaken sharply, which is not evident in the current data.
In this environment, we see an undervaluation case forming within large-cap logistics, distribution technology, and inventory optimization solution providers. These companies benefit when wholesalers prioritize efficiency, turnover speed, and real-time inventory visibility over sheer volume expansion. Their earnings profiles tend to improve as clients invest in systems that preserve margins and working capital. Analysts should monitor inventory turnover trends, order fulfillment efficiency metrics, capital spending on supply chain technology, and margin stability across distribution-heavy sectors to assess whether this efficiency-driven cycle remains intact.
Continuing Claims Signal Labor Stability
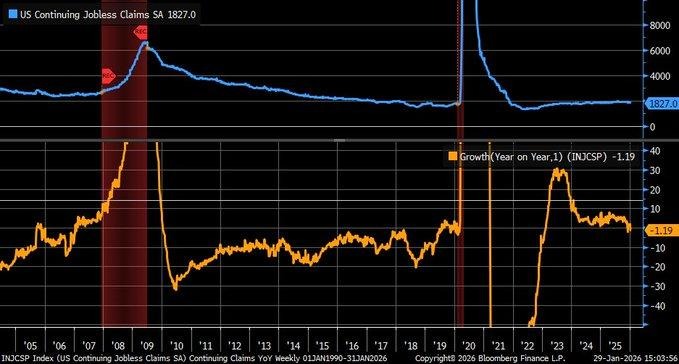
We are observing a meaningful shift in labor market dynamics, with continuing unemployment claims declining on a year-over-year basis and turning negative for the first time in several quarters. This reversal signals that fewer individuals are remaining on extended unemployment support compared with last year, marking a departure from the gradual deterioration seen throughout much of 2024 and early 2025. The trend suggests that job separations are not translating into prolonged unemployment spells, reinforcing the view that labor demand remains resilient even as broader economic conditions tighten. Importantly, this improvement reflects durability rather than overheating, as it comes alongside measured hiring rather than aggressive expansion.
From a macro standpoint, falling continuing claims reduce the probability of a sharp labor-driven slowdown. When extended claims rise, they often foreshadow reduced consumer spending, higher credit stress, and delayed corporate investment. The current decline instead points to income stability and ongoing labor absorption across services and essential industries. This environment supports steady consumption without reigniting wage-driven inflation. Analysts should watch whether this trend is sustained through upcoming claims data and whether participation rates and hours worked remain stable, as these factors will confirm whether labor strength is structural rather than temporary.
Against this backdrop, we see an undervaluation opportunity in large-cap consumer staples and defensive service providers that benefit from steady employment conditions without relying on discretionary excess. These companies typically generate consistent cash flows when job security improves, yet they are often overlooked during periods when markets focus on cyclical growth narratives. Analysts should monitor same-store sales trends, pricing power, wage cost containment, and margin stability to determine whether improving labor conditions translate into durable earnings visibility across defensive sectors.
Capital Spending Momentum Loses Steam
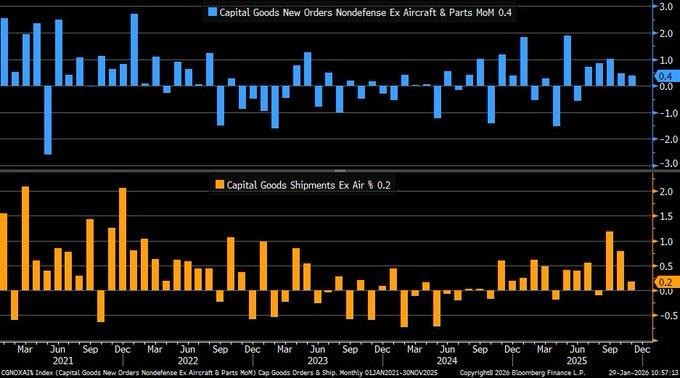
We are seeing a notable recalibration in business investment signals as recent revisions to core capital goods orders and shipments point to softer momentum than initially reported. These indicators, which serve as a proxy for nondefense business equipment spending excluding aircraft, now suggest that capital expenditure growth late in the year was more restrained. The downward adjustments matter because they strip away early optimism and highlight the sensitivity of investment trends to financing costs, demand visibility, and margin uncertainty. After several years of volatile manufacturing cycles, the latest data implies that firms are becoming more cautious about committing to new equipment purchases.
From a macro perspective, slower capital spending growth has implications for both productivity gains and near-term output contributions. When investment cools, it tends to temper future capacity expansion and limits the pace at which efficiency improvements can lift growth. This dynamic also feeds into policy expectations, as softer investment reduces pressure from the demand side of the economy. Analysts should closely monitor whether this moderation reflects a temporary pause driven by uncertainty or a more durable slowdown tied to tighter financial conditions and conservative corporate planning.
Within this environment, we see undervaluation emerging among high-quality industrial technology and capital equipment manufacturers with strong aftermarket and service revenues. These companies are better insulated when new order growth softens, as recurring maintenance, upgrades, and efficiency retrofits help stabilize cash flows. Market pricing often penalizes the entire sector during periods of capex hesitation, creating selective opportunities. Analysts should watch backlog composition, service revenue growth, pricing discipline, and commentary around deferred—not canceled—orders to assess whether underlying investment demand is being postponed rather than abandoned.
Import Weakness Flags Consumer Fatigue
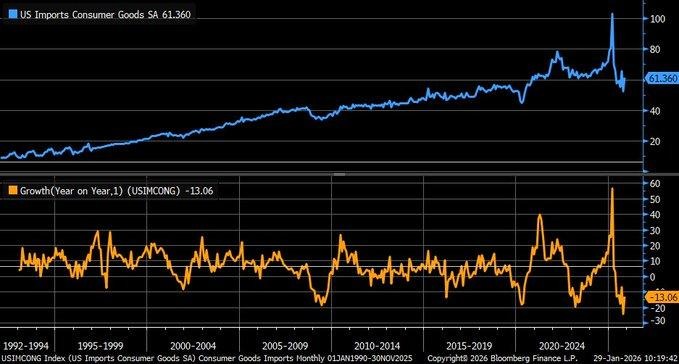
We are seeing a fragile rebound in consumer goods imports late in the year, with month-over-month growth returning after a sharp prior decline, yet the broader trend remains clearly negative. Year-over-year import volumes are still deeply lower, signaling that demand for discretionary goods has not recovered in a meaningful way. This pattern suggests households remain cautious, prioritizing essentials over big-ticket or non-essential purchases. Import data is a useful real-economy signal because it reflects actual spending behavior rather than sentiment, and the persistence of weakness points to ongoing restraint in consumer demand rather than a short-term inventory adjustment.
From a macro perspective, sustained softness in consumer goods imports raises concerns around growth durability. Lower import demand often coincides with slower retail turnover, reduced logistics activity, and weaker pricing power for consumer-facing businesses. It also risks widening trade imbalances if export growth does not offset the decline. This environment implies that growth contributions from consumption could remain muted, especially in discretionary categories such as electronics and household goods. Analysts should monitor retail sales composition, inventory levels at major distributors, and pricing trends to assess whether demand is stabilizing or continuing to erode.
Against this backdrop, we see undervaluation emerging in large-cap consumer staples and value-oriented retailers with exposure to non-discretionary demand. These businesses tend to benefit when consumers trade down rather than stop spending altogether, supporting revenue stability even as overall consumption slows. Market pricing often overlooks this defensive advantage during periods of import-driven weakness. Analysts should focus on inventory turnover efficiency, margin resilience, sourcing flexibility, and cash flow consistency to determine which names are best positioned to weather prolonged softness in discretionary imports.
Upcoming Economic Events
ISM Manufacturing PMI, ISM Manufacturing Prices
As we approach the next major data window, manufacturing indicators take center stage in shaping near-term market expectations. These releases arrive at a time when investors are reassessing the balance between slowing growth signals and lingering inflation pressure. Manufacturing data is particularly influential because it sits at the intersection of demand, pricing power, and corporate confidence. The upcoming figures will help determine whether recent economic resilience is firming into a sustainable trend or losing momentum beneath the surface, with clear implications for rates, yields, currencies, and equity positioning.
ISM Manufacturing PMI
The manufacturing activity index will provide a forward-looking read on production conditions, new orders, and overall business confidence across the industrial sector.
- If the actual reading prints above the forecast, it would suggest that factory activity is stabilizing or improving, signaling healthier demand and greater operational visibility for manufacturers. In this case, markets would likely interpret the data as growth-supportive, lifting cyclical equities, pressuring bond prices, and nudging yields higher as expectations for near-term policy easing are pushed back.
- However, if the reading falls short of expectations, it would reinforce concerns that manufacturing demand remains constrained, increasing downside sensitivity for risk assets, supporting bonds, and favoring defensive equity sectors tied to stable cash flows.
ISM Manufacturing Prices
The prices paid component will be closely scrutinized as a real-time indicator of inflation pressure within supply chains.
- A higher-than-forecast result would indicate that input costs are firming again, raising the risk that margin pressure persists and that pricing pressure continues to flow through to end markets. This outcome would likely weigh on rate-sensitive assets, support sectors with pricing power, and reinforce caution around premature expectations of policy flexibility.
- Conversely, a lower-than-expected prices reading would signal easing cost pressure, improving margin outlooks for manufacturers, and strengthening confidence that inflation risks are moderating. Such an outcome would be supportive for equities, particularly cost-sensitive industries, while easing pressure on bond yields and reinforcing expectations for a more accommodative policy path later in the cycle.
Stock Market Performance
Indexes Recover Strongly from Spring Lows, But Internal Stress Persists
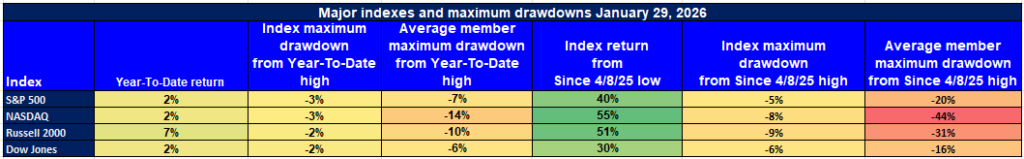
Equity markets have delivered powerful rebounds from the April 8, 2025 lows, yet year-to-date performance remains modest and internal drawdowns continue to highlight uneven participation beneath the surface. While headline indexes suggest stability, the gap between index-level strength and average member performance points to a market still reliant on select leadership rather than broad-based conviction. From our perspective at Zaye Capital Markets, this divergence keeps overall risk conditions elevated despite the recovery.
Here’s how we break down performance across the major indexes, using the latest figures:
S&P 500: Headline Stability Masks Uneven Participation
YTD: +2% | +40% since 4/8/25 low | -3% from YTD high | Avg. member: -7%
The S&P 500 is up 2% year-to-date and has rebounded sharply by 40% from its April low, underscoring strong recovery momentum at the index level. However, the average member drawdown of 7% from the YTD high highlights that many constituents remain under pressure. Since the April low, the index itself has seen a maximum drawdown of 5%, while the average stock experienced a much deeper 20% pullback, reinforcing concerns around narrow leadership.
NASDAQ: Powerful Rebound, Severe Internal Volatility
YTD: +2% | +55% since 4/8/25 low | -3% from YTD high | Avg. member: -14%
The NASDAQ shows one of the strongest recoveries, surging 55% from its April trough, yet year-to-date gains remain limited at 2%. The contrast is striking when looking beneath the surface: while the index drawdown since the low is 8%, the average member has suffered a 44% drawdown. This disparity signals ongoing stress within growth and technology names despite the impressive index-level rebound.
Russell 2000: Small-Caps Lead YTD, But Risk Remains Elevated
YTD: +7% | +51% since 4/8/25 low | -2% from YTD high | Avg. member: -10%
The Russell 2000 stands out with a 7% gain year-to-date and a 51% advance from April lows, reflecting renewed interest in smaller companies. Still, the average constituent remains 10% below its YTD high, and since the April low the average member drawdown reaches 31%, compared with a 9% index-level pullback. This suggests that while small-cap leadership has improved, volatility remains a defining feature.
Dow Jones: Relative Stability with Lower Internal Stress
YTD: +2% | +30% since 4/8/25 low | -2% from YTD high | Avg. member: -6%
The Dow Jones has delivered a steadier profile, rising 2% year-to-date and 30% from the April low. Drawdowns are comparatively contained, with the index down 6% from the April low peak and the average member down 16%. While not immune to volatility, the Dow’s composition continues to provide relative insulation versus more growth-heavy benchmarks.
At Zaye Capital Markets, we remain cautious but constructive, focusing on quality exposure while closely monitoring market breadth and average member drawdowns. Sustainable upside will ultimately require broader participation, not just index-level resilience.
The Strongest Sector in All These Indices
Energy Dominates Sector Performance as Leadership Narrows in Early 2026
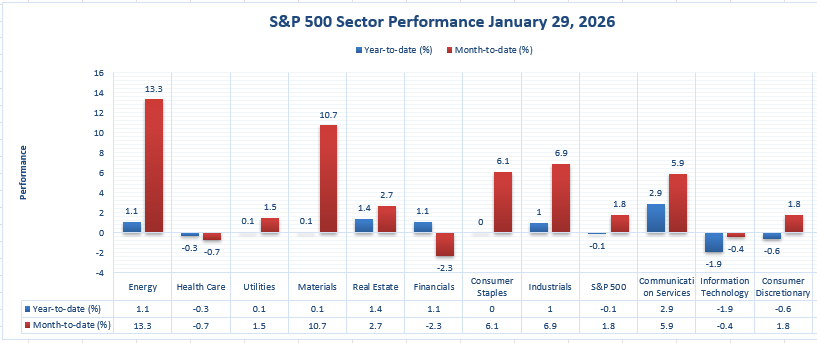
From our perspective at Zaye Capital Markets, sector-level performance shows a clear and decisive leader emerging early in the year. Based strictly on the latest S&P 500 sector data, Energy stands out as the strongest sector by a wide margin, delivering a +13.3% year-to-date gain. This performance far exceeds the broader index, which is up just +1.8% year-to-date, highlighting how concentrated returns have become. Materials follows as the second-strongest performer at +10.7% year-to-date, reinforcing the theme that capital is gravitating toward resource-linked and inflation-sensitive areas rather than broad market exposure.
Daily performance reinforces this leadership rather than contradicting it. Energy advanced +1.1% on the session, maintaining positive momentum alongside its dominant year-to-date showing. Materials, while only up +0.1% on the day, continues to hold a structurally strong position relative to other sectors. In contrast, several areas showing solid one-day moves lack the same consistency over time. Communication Services, for example, rose +2.9% on the day but sits at +5.9% year-to-date, well below Energy’s pace. Industrials gained +1.0% on the day and are up +6.9% year-to-date, respectable but still clearly secondary in leadership.
The divergence becomes more evident when viewed against weaker sectors. Financials are down -2.3% year-to-date despite a +1.1% daily gain, while Information Technology is negative both on the day (-1.9%) and year-to-date (-0.4%). Health Care is also lagging at -0.7% year-to-date. This dispersion confirms that the strongest sector signal across all readings is not driven by short-term volatility but by sustained performance. From our standpoint at Zaye Capital Markets, Energy’s +13.3% year-to-date gain represents the clearest expression of market leadership, with Materials providing secondary confirmation, while the broader market continues to struggle for balanced participation.
Earnings
Earnings Recap – January 30, 2026
- Chevron Corporation For the Q4 and full year 2025 period, Chevron reported Q4 revenue of 46.9 billion USD and GAAP net income of 2.8 billion USD, translating into diluted EPS of 1.39 USD. Adjusted earnings were approximately 3.0 billion USD, supported primarily by upstream earnings of 3.6 billion USD, while downstream earnings were negative due to margin compression. Cash flow from operations reached about 8.2 billion USD in the quarter, with capital expenditures of roughly 4.5 billion USD. For full-year 2025, revenue totaled approximately 200 billion USD, net income was around 21 billion USD, and free cash flow reached about 31 billion USD, enabling dividends of roughly 11 billion USD and share repurchases of about 15 billion USD.
- Exxon Mobil Corporation delivered Q4 revenue of approximately 84.3 billion USD and GAAP net income of about 6.5 billion USD, with diluted EPS of 1.53 USD. Adjusted earnings were approximately 7.3 billion USD, driven by upstream earnings of around 6.2 billion USD, alongside downstream earnings of about 0.8 billion USD and chemical earnings of roughly 0.4 billion USD. Cash flow from operations totaled about 14.7 billion USD, while capital expenditures reached approximately 6.4 billion USD. For full-year 2025, revenue was approximately 338 billion USD and free cash flow reached about 55 billion USD, supporting dividends of roughly 15 billion USD and share repurchases of around 17 billion USD.
- Verizon Communications Inc. reported Q4 revenue of approximately 35.1 billion USD, with service revenue of about 26.7 billion USD and GAAP net income of roughly 5.0 billion USD. Diluted EPS stood at 1.18 USD, while adjusted EPS was approximately 1.08 USD. Wireless retail postpaid net adds were negative, highlighting ongoing competitive pressures. Full-year revenue reached about 134.9 billion USD, free cash flow totaled approximately 18 billion USD, and total debt reduction was around 10 billion USD.
- Air Products and Chemicals, Inc. For fiscal Q1 2026, the company reported revenue of approximately 3.0 billion USD and GAAP net income of around 710 million USD, with diluted EPS of about 3.05 USD. Operating income reached roughly 780 million USD, representing an operating margin of approximately 24 percent, while capital expenditures were elevated at about 1.6 billion USD.
- Colgate-Palmolive Company posted Q4 revenue of approximately 5.0 billion USD and GAAP net income of about 730 million USD, with diluted EPS of 0.88 USD. Gross margin stood near 59 percent. For full-year 2025, revenue reached approximately 19.5 billion USD and free cash flow totaled about 3.6 billion USD.
- American Express Company reported Q4 revenue of approximately 15.8 billion USD and GAAP net income of about 2.4 billion USD, with diluted EPS of roughly 3.05 USD. Provision for credit losses increased to around 1.2 billion USD, even as card member spending grew at a double-digit rate year over year.
- SoFi Technologies, Inc. delivered Q4 revenue of 1.03 billion USD and GAAP net income of approximately 48 million USD, with diluted EPS of about 0.05 USD. Adjusted EBITDA reached roughly 318 million USD, while member count rose to about 13.7 million and products to approximately 19.4 million.
- IES Holdings, Inc. reported Q4 revenue of approximately 670 million USD and net income of about 63 million USD, translating into diluted EPS of roughly 3.10 USD. Full-year revenue reached approximately 2.4 billion USD, with record backlog disclosed but not quantified.
- Aon plc posted Q4 revenue of approximately 3.7 billion USD and GAAP net income of about 730 million USD, with diluted EPS of roughly 3.35 USD. Full-year revenue totaled approximately 14.7 billion USD, supported by mid-single-digit organic revenue growth.
- Hexagon AB reported Q4 revenue of approximately 1.55 billion EUR and operating income of about 470 million EUR, producing an operating margin near 30 percent. For full-year 2025, revenue reached approximately 5.6 billion EUR with an operating margin of about 31 percent and strong free cash flow, though the exact figure was not disclosed.
Earnings Preview – Due February 2, 2026
- Julius Baer Group Ltd. Investors will focus on net new asset flows, client activity trends, and margin sensitivity to interest rate conditions, as wealth management firms face shifting asset allocation behavior.
- Walt Disney Company (The) Key areas to watch include streaming profitability, content spending discipline, theme park attendance trends, and forward guidance on margins across entertainment and experiences segments.
- Palantir Technologies Inc. Attention will center on revenue growth durability, government and commercial contract momentum, operating margin progression, and forward commentary on demand visibility.
- NXP Semiconductors N.V. Investors should monitor automotive and industrial chip demand, inventory normalization, and margin resilience amid a mixed global manufacturing backdrop.
- TDK Corp. Focus will be on electronic component demand trends, margin pressures from input costs, and guidance related to industrial and consumer end markets.
Stock Market Overview – Monday, 2 Feb 2026
U.S. equity markets opened the new week under pressure as investors reassess risk amid elevated valuation sensitivity, persistent inflation concerns, and rising cross-asset volatility. While headline indices remain near historically high levels, market internals continue to weaken, reflecting narrow leadership and growing dispersion beneath the surface. From our perspective at Zaye Capital Markets, this remains a selective and fragile market environment rather than a broad-based risk-on phase.
Stock Prices
Economic Indicators and Geopolitical Developments
Today’s market tone reflects concern that expectations for easier financial conditions have moved ahead of underlying economic reality. Sticky inflation signals, firm policy rhetoric, and renewed geopolitical uncertainty continue to keep yields elevated and liquidity conditions tight. At the same time, volatility across commodities, digital assets, and rates is reinforcing defensive positioning. Investors remain highly sensitive to macro surprises, with risk appetite thinning across speculative, leveraged, and rate-sensitive areas of the market.
Latest Stock News
Memory markets are tightening sharply as DRAM pricing accelerates into the first quarter of 2026. PC memory prices are up roughly 110% quarter over quarter, while server DRAM pricing has surged around 90%. As February contracts finalize, Micron Technology ($MU) is pushing server DRAM price increases of approximately 120%, underscoring how memory has re-emerged as a critical bottleneck in the AI and data-center supply chain. The pressure is already filtering through to consumers, with PC manufacturers warning of laptop price increases of roughly 20% in the first half of the year.
In cloud infrastructure, Oracle ($ORCL) plans to raise approximately 50 billion USD in 2026 through a mix of debt and equity to expand Oracle Cloud Infrastructure capacity. The capital raise is aimed at meeting contracted demand from major customers including Advanced Micro Devices ($AMD), Meta Platforms ($META), Nvidia ($NVDA), OpenAI, TikTok, and xAI, reinforcing how hyperscale demand continues to exceed available capacity despite tighter financial conditions.
Artificial intelligence remains the dominant strategic theme. OpenAI is laying the groundwork for a potential fourth-quarter public offering while expanding its finance team. Nvidia ($NVDA) continues to reinforce its leadership in AI acceleration, highlighting that its Blackwell platform is widening the performance gap versus competing models. While talks around a potential large-scale Nvidia–OpenAI transaction have reportedly stalled, Nvidia has reiterated plans to make substantial investments into OpenAI, framing it as potentially the largest investment in the company’s history. Nvidia also emphasized that demand for advanced packaging and wafers remains exceptionally strong at Taiwan Semiconductor Manufacturing Company ($TSM), and that AI performance increasingly depends on both high-bandwidth memory and LPDDR — a structural tailwind for suppliers such as Micron ($MU). Management further underscored that custom silicon efforts from Alphabet ($GOOGL), Amazon ($AMZN), Microsoft ($MSFT), and Meta Platforms ($META) continue to lag Nvidia’s full-stack AI focus built around CUDA, NVLink, and sustained annual investment of roughly 20 billion USD.
In aerospace and advanced manufacturing, Rocket Lab ($RKLB) achieved a meaningful execution milestone with the successful delivery and unwrapping of its Hungry Hippo hardware inside Neutron’s Assembly and Integration Complex in Virginia. While incremental, this step reduces program risk and follows Rocket Lab’s second Electron launch of 2026, reinforcing improving operational cadence.
Private market activity remains intense. SpaceX is reportedly on track for approximately 16 billion USD in revenue with roughly 8 billion USD in EBITDA, driven primarily by Starlink, which accounts for an estimated 50–80% of sales. The company is targeting a June public offering to raise around 50 billion USD at an implied valuation near 1.5 trillion USD. SpaceX has also filed to deploy up to one million satellites designed to function as solar-powered orbital data centers, aiming to scale AI compute capacity without adding strain to terrestrial power grids.
In financial services, SoFi Technologies ($SOFI) posted its largest quarterly member addition on record, adding one million new members in the fourth quarter as it positions itself as a unified digital platform spanning banking, investing, and digital assets. In autonomous mobility, Waymo is finalizing a 16 billion USD funding round at an estimated 110 billion USD valuation, with Alphabet ($GOOGL) supplying more than 75% of the capital. Annual recurring revenue is reported above 350 million USD, and the round was significantly oversubscribed, underscoring investor confidence despite growing complexity in advanced AI systems.
Finally, physical resource constraints are becoming increasingly visible. ASML Holding ($ASML) remains critical to advanced semiconductor manufacturing through its extreme ultraviolet lithography systems, enabling ever-smaller and more energy-efficient chip designs. Amazon ($AMZN) secured U.S.-mined copper supply for the first time in over a decade, sourcing from Rio Tinto ($RIO) to support AWS data-center expansion, highlighting how copper is emerging as the next hard constraint alongside energy and advanced semiconductors.
The Magnificent Seven and the S&P 500
The S&P 500 remains heavily influenced by the “Magnificent Seven,” but that concentration has become a source of vulnerability. These stocks are being punished as valuation compression, earnings normalization, and elevated discount rates intersect. With leadership increasingly narrow, weakness in a handful of names is exerting disproportionate pressure on index performance. The lack of broad participation continues to mask deeper structural fragility beneath headline resilience.
Major Index Levels as of Monday, 2 Feb 2026
- Nasdaq Composite: Trading at 23,501.24, supported by selective large-cap technology strength amid elevated volatility.
- S&P 500: Trading at 6,915.61, holding near recent highs but struggling to extend gains due to narrow leadership.
- Dow Jones Industrial Average: Trading at 49,098.71, facing modest pressure as industrial and value components react to tighter conditions.
- Russell 2000: Trading at 2,669.16, underperforming as small-cap and economically sensitive stocks remain constrained.
At Zaye Capital Markets, we continue to view this as a **selective, risk-managed environment**. Elevated index levels are being sustained by a shrinking leadership group, while macro uncertainty, valuation sensitivity, and weak breadth continue to cap upside potential. Quality exposure, balance-sheet strength, and disciplined positioning remain essential until participation broadens and policy clarity improves.
Gold Price: Why Is Gold Volatile as Policy Signals Shift and Key U.S. Data Looms?
Spot gold is currently trading around $4,680 per ounce, reflecting a sharp adjustment from recent highs after an extended rally. The pullback comes as markets digest a dense mix of policy signals, political developments, and shifting expectations around interest rates. Recent comments around central bank leadership and rate preferences have injected uncertainty into the policy outlook, briefly supporting the currency and pushing real yields higher, which typically pressures non-yielding assets like gold. At the same time, political developments spanning government funding risks, geopolitical negotiations in the Middle East, shifting diplomatic stances, and heightened domestic policy debates continue to reinforce gold’s role as a macro hedge. With today’s ISM Manufacturing PMI and ISM Manufacturing Prices data due, markets are positioned cautiously: weaker-than-expected readings would likely revive growth concerns and support renewed demand for gold, while stronger pricing data could extend short-term pressure through higher yield expectations without undermining gold’s longer-term relevance.
Yesterday’s economic data added to this two-way tension. Persistent producer-side inflation, firm services pricing, and signs of slowing momentum have kept inflation expectations elevated while raising concerns about growth durability. This combination constrains real yields over the medium term and supports structural demand for gold despite near-term volatility. At the same time, ongoing political uncertainty, funding negotiations, and geopolitical dialogue reinforce hedging behavior among institutions seeking protection against policy missteps and macro instability. The recent price decline reflects positioning stress and profit-taking following an aggressive advance rather than a deterioration in gold’s fundamental role within the broader financial ecosystem. As markets await confirmation from manufacturing data, gold remains tightly linked to expectations around growth, inflation persistence, and policy flexibility, with volatility likely to remain elevated as these narratives compete.
Oil Prices: Why Are Oil Prices Volatile as Geopolitics, Policy Signals, and Data Collide?
Crude oil prices are trading in a volatile but defined range as of Monday, 2 February 2026, with Brent crude near the mid-$60s per barrel and WTI crude in the low-$60s, after pulling back from recent highs. The back-and-forth price action reflects competing forces rather than a clear trend. On one side, geopolitical risk premiums that had built up earlier in January have eased as diplomatic signals around Iran and other oil-producing regions reduce the immediate probability of supply disruption. On the other, comments around energy flows involving Venezuela, India, and broader global supply realignments keep traders cautious about writing off upside risk entirely. Political signaling around central bank leadership and interest rates also matters indirectly for oil, as tighter financial conditions and a stronger currency tend to pressure commodity prices by dampening speculative demand. This explains why oil has struggled to sustain rallies even as geopolitical headlines remain active.
Yesterday’s economic data added another layer of complexity to oil sentiment. Persistent cost pressures alongside signs of slowing momentum have raised concerns about demand durability, particularly for industrial and transportation fuel consumption. When growth indicators soften, oil markets tend to price in weaker future demand, limiting upside even in the presence of supply discipline. At the same time, organizations influencing the oil balance remain central to expectations: OPEC’s continued supply restraint provides a floor, while global energy agencies continue to flag uneven demand recovery rather than outright contraction. Looking ahead, today’s ISM Manufacturing PMI and ISM Manufacturing Prices data are pivotal. A weaker PMI would reinforce demand concerns and likely pressure oil lower, while stronger manufacturing activity or firmer pricing would support stabilization by signaling resilient industrial fuel usage. In short, oil is being pulled between geopolitical uncertainty, policy expectations, and demand sensitivity, keeping prices range-bound rather than directional.
Bitcoin Prices: Why Is Bitcoin Under Pressure as Rate Signals Shift and Liquidity Tightens?
As of Monday, 2 February 2026, Bitcoin is trading around $76,000, marking a decisive decline from the highs near the $95,000–$98,000 range seen earlier in January. The move reflects a broad macro-driven repricing rather than a crypto-specific shock. Recent political comments around central bank leadership and interest-rate preferences have injected uncertainty into the policy outlook. While public messaging has emphasized support for lower rates over time, markets have interpreted the sequence of signals as implying delay rather than immediacy. That interpretation has lifted real yields and stabilized the dollar, both of which act as direct headwinds for Bitcoin in the current environment. As a result, Bitcoin has failed to function as a geopolitical hedge and has instead traded in line with high-beta risk assets, breaking key technical levels as ETF outflows, declining large-holder activity, and reduced liquidity amplified downside pressure.
Yesterday’s economic data reinforced this fragile setup. Persistent inflation pressures alongside signs of slowing momentum strengthened the view that financial conditions may remain restrictive longer than previously expected. This combination discourages speculative exposure and increases the opportunity cost of holding volatile, non-yielding assets such as Bitcoin. The recent sell-off has also been intensified by forced liquidations across derivatives markets, highlighting how leverage rather than fundamentals has driven much of the downside. Looking ahead, today’s ISM Manufacturing PMI and ISM Manufacturing Prices data will be pivotal. A weaker outcome would likely deepen risk aversion and keep Bitcoin under pressure as growth concerns dominate sentiment. A stronger reading could provide short-term stabilization by improving broader risk appetite, but given the recent technical breakdown and fragile positioning, a sustained recovery would likely require clearer signs of easing liquidity conditions rather than isolated data surprises. In this context, Bitcoin remains highly sensitive to macro policy expectations and real-yield dynamics rather than acting as an independent store of value.
ETH Prices: Why Is Ethereum Volatile as ETF Flows and Whale Activity Reshape the Market?
Spot Ethereum is currently trading around $2,250–$2,300, reflecting a sharp repricing from January highs above the $3,300 area as broader risk conditions tightened and liquidity thinned across digital asset markets. The recent decline has been driven by a combination of macro pressure and crypto-specific flows rather than a single catalyst. Over the past week, Ethereum-linked ETF activity has been uneven, with brief inflows failing to offset renewed outflows as investors reduced exposure to higher-beta assets. This lack of sustained institutional demand has removed an important layer of price support, leaving ETH more exposed to spot selling and derivatives-driven moves. At the same time, on-chain data has shown increased large-holder transfers to exchanges, particularly during periods of lower liquidity, a pattern that historically coincides with distribution rather than accumulation and tends to amplify downside volatility in the short term.
Yesterday’s economic data reinforced this fragile backdrop. Persistent inflation signals alongside softer growth momentum have kept real yields elevated and risk appetite constrained, conditions that typically weigh more heavily on Ethereum than on larger, more established digital assets. This macro environment has encouraged further deleveraging across crypto markets, with ETH experiencing a deeper drawdown as leveraged positions were unwound. While there are early indications of selective buying at lower levels, whale behavior over the past several sessions remains mixed, suggesting caution rather than conviction. Looking ahead, Ethereum’s near-term direction remains closely tied to whether ETF flows stabilize and whether large holders shift from distribution to sustained accumulation. Until those conditions improve and broader liquidity expectations ease, ETH is likely to remain volatile and sensitive to macro data and risk sentiment rather than driven by standalone network fundamentals.
